Upload date
All time
Last hour
Today
This week
This month
This year
Type
All
Video
Channel
Playlist
Movie
Duration
Short (< 4 minutes)
Medium (4-20 minutes)
Long (> 20 minutes)
Sort by
Relevance
Rating
View count
Features
HD
Subtitles/CC
Creative Commons
3D
Live
4K
360°
VR180
HDR
10,879,790 results
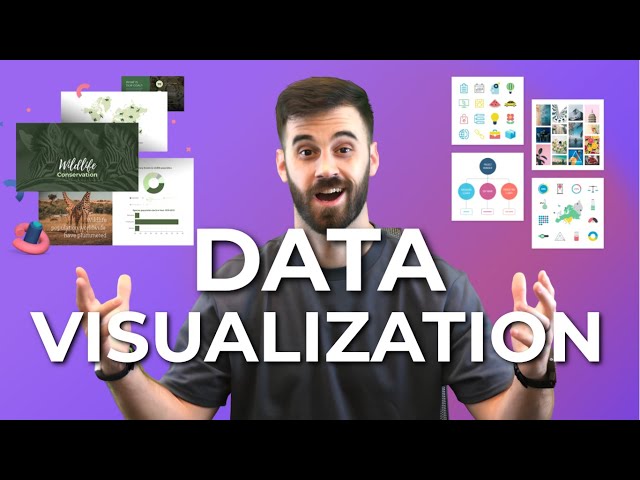
You've probably heard the term data visualization thrown around a lot. It's why you're here, isn't it? So let's make it clear — data ...
181,711 views
3 years ago
Nano Banana + Gemini 3: The Data Visualization Workflow You Need | Stop Making Boring Charts – Use This Nano Banana + ...
25,049 views
3 months ago
View full lesson: http://ed.ted.com/lessons/david-mccandless-the-beauty-of-data-visualization David McCandless turns complex ...
1,569,400 views
13 years ago
Effective data visualisation comes in many shapes and sizes, but how do you move away from a standard bar chart? Watch the ...
79,018 views
4 years ago
Let's look at how we can implement design concepts and techniques to maximize the impact of our dashboards and reports.
86,854 views
MENTORSHIP – Applications for the March 2026 cohort are now open! Apply here → https://theanalyticsaccelerator.com/ We're ...
50,935 views
11 months ago
Data visualization is present in every aspect of our lives - but is it really as unbiased as it's said to be? In this SciToons video, learn ...
138,661 views
7 years ago
Setup, conflict, resolution. You know right away when you see an effective chart or graphic. It hits you with an immediate sense of ...
638,186 views
6 years ago
Links mentioned in this video ⬇️ Exercise File ...
250,352 views
2 years ago
Viewers like you help make PBS (Thank you ) . Support your local PBS Member Station here: http://to.pbs.org/Donateoffbook ...
510,466 views
12 years ago
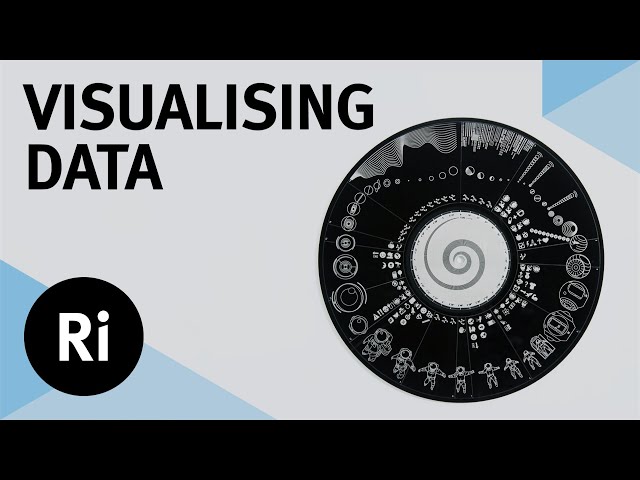
Following a look at 'Sensemaking' Associate Professor Dr Kai Xu delves into some more tricks of the visualisation trade.
75,400 views
"️ IBM - Data Analyst ...
320,857 views
8 years ago
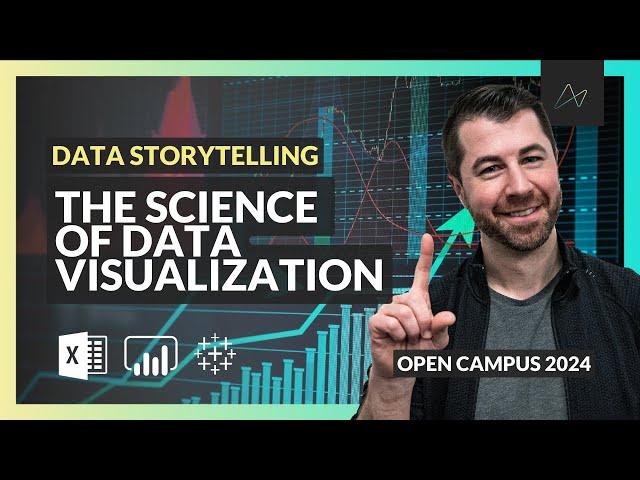
Data storytelling is one of the most important skills for any data professional. Those who do it effectively can drive serious impact ...
23,601 views
1 year ago
In this video, we will demonstrate the difference between data visualization charts including: - Bar Chart - Line Chart - Bubble ...
189,167 views
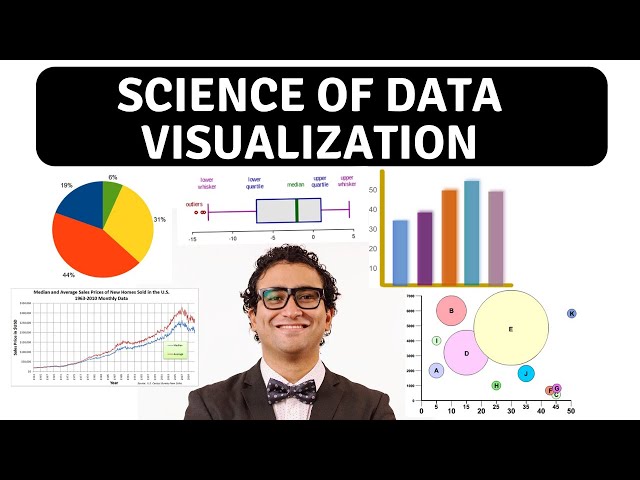
In this video, I break down some of the 'science' behind effective data visualization and how you can build better dashboards by ...
384,164 views
THE CHALLENGE: "teach me statistics in half an hour with no mathematical formula" The RESULT: an intuitive overview of ...
3,311,111 views
Lear Data Cleaning Essentials in Excel in just 10 minutes Take our Excel course: ...
1,231,979 views
Curious about a career in Data Analytics? Book a call with a program advisor: https://bit.ly/47LEBk3 What exactly is data analytics ...
2,063,737 views
In this brief video, we define what data visualization is – and what it isn't – and how psychology plays a role in helping humans ...
7,013 views
Learn Data Visualization with D3, JavaScript, and React. Part 2: https://youtu.be/H2qPeJx1RDI Created by @currankelleher .
519,583 views
5 years ago
Dustin hopes that the audience learns how anyone can use data visualization to improve their work, understand their world, and ...
72,963 views