ViewTube

ViewTube
Sign inSign upSubscriptions
Filters

Upload date

Type

Duration

Sort by

Features

Reset

219 results

The Institute for Creativity, Arts, and Technology
ICAT Playdate — Data Visualization with Community Pulse

Submit a question: https://icat.vt.edu/questions Learn more: https://icat.vt.edu/events/2022/09/icat-playdate---community-pulse.html ...

35:05
ICAT Playdate — Data Visualization with Community Pulse

528 views

Streamed 3 years ago

Simon Elvery
Hacks/Hackers August—Geo data and visualisation
1:58:52
Hacks/Hackers August—Geo data and visualisation

122 views

Streamed 9 years ago

augmentyourmind
NGVR Meetup #10: Data Visualization in VR/AR - Enterprise to Everyday Cases

We experienced technical difficulties, please skip to 13:00 and enjoy the event in 360VR ...

1:20:00
NGVR Meetup #10: Data Visualization in VR/AR - Enterprise to Everyday Cases

312 views

8 years ago

Anhub Metaverse
BUSI650 Business Analytics Week #4 (1/4) Class (360 VR): Data Visualization  using Tableau @ UCW 🇨🇦

Week 4: Data Visualization (DV) using Tableau · Why Data Visualization? · Introduction to Tableau · In-class Demo on Data ...

29:02
BUSI650 Business Analytics Week #4 (1/4) Class (360 VR): Data Visualization using Tableau @ UCW 🇨🇦

61 views

3 years ago

Anhub Metaverse
BUSI650 Business Analytics Week #4 (2/4) Class (360 VR): Data Visualization  using Tableau @ UCW 🇨🇦

Week 4: Data Visualization (DV) using Tableau · Why Data Visualization? · Introduction to Tableau · In-class Demo on Data ...

29:02
BUSI650 Business Analytics Week #4 (2/4) Class (360 VR): Data Visualization using Tableau @ UCW 🇨🇦

63 views

3 years ago

Bulgarian Java User Group
jProfessionals Winter edition 2020   Data Driven Dashboards, Philipp Krenn

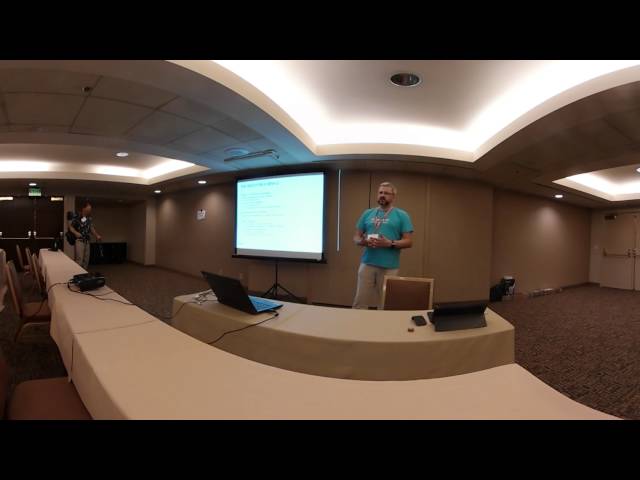
... this kind of visualization I want to change it and then it will look something like this so you could just here explore your data very ...

52:14
jProfessionals Winter edition 2020 Data Driven Dashboards, Philipp Krenn

203 views

6 years ago

Rupert Chappelle
William "Tom" Bridgman, USNO Data Visualization in Space Science

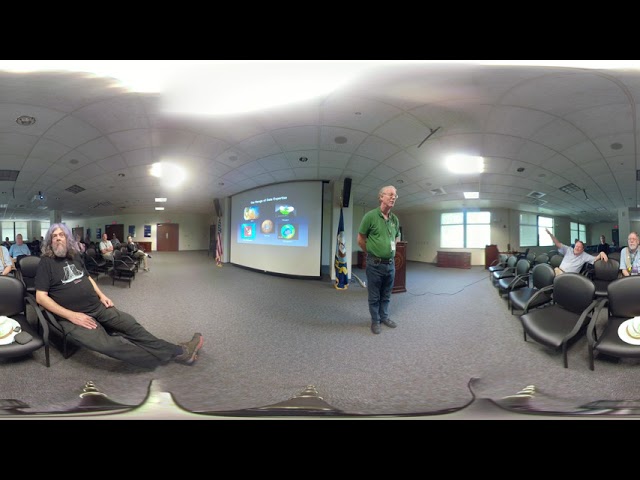
William "Tom" Bridgman Data Visualization in Space Science USNO Scientific Colloquia Montgomery College 360.

1:09:54
William "Tom" Bridgman, USNO Data Visualization in Space Science

267 views

7 years ago

Trust Insights
MAICON 2022 Exploratory Data Analysis VR session

Few things guarantee success with AI, but one thing guarantees failure: skipping exploratory data analysis. In this brand new, ...

40:59
MAICON 2022 Exploratory Data Analysis VR session

50 views

3 years ago

Anhub Metaverse
BUSI650 Business Analytics Week #4 (3/4) Class (360 VR): Data Visualization  using Tableau @ UCW 🇨🇦

Week 4: Data Visualization (DV) using Tableau · Why Data Visualization? · Introduction to Tableau · In-class Demo on Data ...

29:02
BUSI650 Business Analytics Week #4 (3/4) Class (360 VR): Data Visualization using Tableau @ UCW 🇨🇦

65 views

3 years ago

Sensilab monash
SensiLab Forum - Barrett Ens

... view the the data visualization see how many people are in the museum and you can choose the particular server that you want ...

48:12
SensiLab Forum - Barrett Ens

140 views

Streamed 8 years ago

Michael McCandless
Exploratory Data Analysis with Solr (Christopher Ball) - Sep 13 2025 - Community Over Code NA
56:18
Exploratory Data Analysis with Solr (Christopher Ball) - Sep 13 2025 - Community Over Code NA

89 views

5 months ago

Anhub Metaverse
BUSI650-27 Business Analytics (1/5 VR 360)  WK10 Team Project Presentation & Competition @UCW 🇨🇦

... of the data 3.2 Tools/Analytics • Mention the tools and techniques used to analyze the data, including o Data Visualization using ...

29:02
BUSI650-27 Business Analytics (1/5 VR 360) WK10 Team Project Presentation & Competition @UCW 🇨🇦

108 views

2 years ago

FulldomeFestival
FullDome Festival 2020: SCIENCE IN THE DOME Council

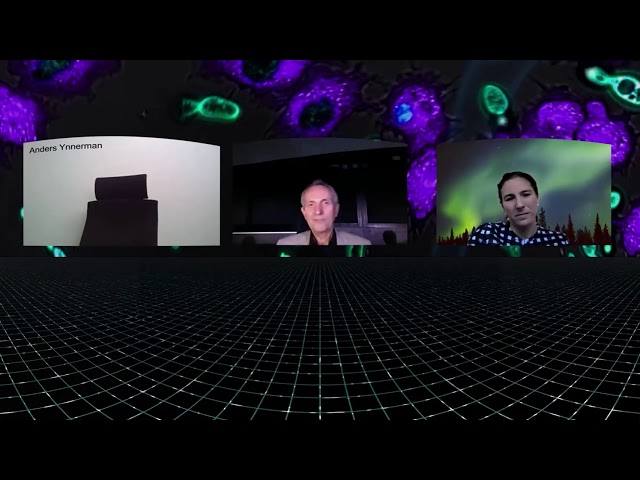
How can the immersive environment of a Planetarium or fulldome theatre enhance scientific education? How can 360-degrees ...

1:44:28
FullDome Festival 2020: SCIENCE IN THE DOME Council

332 views

5 years ago

Harvard Visualization Lab
Harvard Viz Lab 360
1:42:06
Harvard Viz Lab 360

48 views

Streamed 7 years ago

Anhub Metaverse
BUSI650 Business Analytics Week #4 (4/4) Class (360 VR): Data Visualization using Tableau @ UCW 🇨🇦

Week 4: Data Visualization (DV) using Tableau · Why Data Visualization? · Introduction to Tableau · In-class Demo on Data ...

25:51
BUSI650 Business Analytics Week #4 (4/4) Class (360 VR): Data Visualization using Tableau @ UCW 🇨🇦

64 views

3 years ago

3D Repo
360° - Web3D 2016 Special Session: Industrial Use Cases

SPECIAL SESSION: Industrial Use Cases - Building Information Modelling in UK on the Web : 3D Repo Jozef Dobos, Sebastian ...

1:08:45
360° - Web3D 2016 Special Session: Industrial Use Cases

199 views

9 years ago

Anhub Metaverse
BUSI650 Business Analytics Week 1 (2/4) Class (360 VR): Course Introduction  @UCW Canada 🇨🇦

Week 1: Introduction to Business Analytics · Introductions · What are Business Analytics, Data analytics, and modeling?

29:02
BUSI650 Business Analytics Week 1 (2/4) Class (360 VR): Course Introduction @UCW Canada 🇨🇦

138 views

3 years ago

Anhub Metaverse
BUSI650-27 Business Analytics (5/5 VR 360)  WK10  Team Project Presentation & Competition @UCW 🇨🇦

... of the data 3.2 Tools/Analytics • Mention the tools and techniques used to analyze the data, including o Data Visualization using ...

25:01
BUSI650-27 Business Analytics (5/5 VR 360) WK10 Team Project Presentation & Competition @UCW 🇨🇦

60 views

2 years ago

Anhub Metaverse
BUSI650 Business Analytics Week#5 (1/4) Class (360 VR): Data Cluster & Linear Regression @ UCW 🇨🇦

... roles: Data Visualization using Tableau and Data Analytics using Excel/R/Python Proposed Dataset for Tableau/PowerBI Data ...

29:02
BUSI650 Business Analytics Week#5 (1/4) Class (360 VR): Data Cluster & Linear Regression @ UCW 🇨🇦

58 views

3 years ago

Anhub Metaverse
BUSI650 Business Analytics Week 10 Class (VR): 1/16 Team Project Presentation & Competition @UCW 🇨🇦

... of the data 3.2 Tools/Analytics • Mention the tools and techniques used to analyze the data, including o Data Visualization using ...

29:02
BUSI650 Business Analytics Week 10 Class (VR): 1/16 Team Project Presentation & Competition @UCW 🇨🇦

65 views

3 years ago