ViewTube

ViewTube
Sign inSign upSubscriptions
Filters

Upload date

Type

Duration

Sort by

Features

Reset

324,490 results

freeCodeCamp.org
Excel Data Visualization Course – Guide to Charts & Dashboards

This comprehensive tutorial will teach you everything you need to know about Excel chart types, chart customization, and creating ...

1:10:23
Excel Data Visualization Course – Guide to Charts & Dashboards

112,096 views

1 year ago

Kevin Stratvert
Excel Charts and Graphs Tutorial

Learn Excel in just 2 hours: https://kevinstratvert.thinkific.com In this step-by-step tutorial, learn how to pull together charts in Excel.

24:31
Excel Charts and Graphs Tutorial

1,294,468 views

2 years ago

Chandoo
The Ultimate Excel Dashboard: Visualize Data Like a Pro

OFF My Dashboards Course (code: SAVE50) https://chandoo.org/wp/excel-school-program/ ~ Become an Excel Dashboard ...

29:50
The Ultimate Excel Dashboard: Visualize Data Like a Pro

98,404 views

4 months ago

Simon Sez IT
Interactive Excel Charts and Dashboards - Data Visualization Course

Download the free course files and follow along here: ➡️https://www.simonsezit.com/charts-and-dashboards-in-excel-demo-files ...

2:39:02
Interactive Excel Charts and Dashboards - Data Visualization Course

12,893 views

1 year ago

Teacher's Tech
Turn Raw Data into a Clear, Interactive Dashboard in Excel

Ready to transform your spreadsheets from ordinary to extraordinary? In this tutorial, you'll learn how to take raw, unorganized ...

23:36
Turn Raw Data into a Clear, Interactive Dashboard in Excel

126,545 views

1 year ago

Simon Sez IT
How to Create Data Visualization in Excel using Tables, Slicers and Charts (Includes Free Files)

Download the free course files and follow along here: ...

46:13
How to Create Data Visualization in Excel using Tables, Slicers and Charts (Includes Free Files)

2,982 views

4 months ago

Luke Barousse
Excel for Data Analytics - Full Course for Beginners

FREE Course Files & Projects https://lukeb.co/excel_files Supporter Access: Problems, Certificate, & More ...

10:59:43
Excel for Data Analytics - Full Course for Beginners

2,494,494 views

1 year ago

Teacher's Tech
How to Transform Excel Data into a Striking Visual Report with Microsoft Power BI

Welcome to this beginner's tutorial on how to use Microsoft Power BI! In this video, I will guide you through importing data from an ...

30:22
How to Transform Excel Data into a Striking Visual Report with Microsoft Power BI

206,979 views

3 years ago

Simplilearn
DATA VISUALIZATION In EXCEL | How To Build Interactive CHARTS In EXCEL | Simplilearn #excel #charts

"️ IBM - Data Analyst ...

21:06
DATA VISUALIZATION In EXCEL | How To Build Interactive CHARTS In EXCEL | Simplilearn #excel #charts

14,520 views

2 years ago

Alex The Analyst
Full Project in Excel | Excel Tutorials for Beginners

Take my Full Excel for Data Analytics Course! https://www.analystbuilder.com/courses/excel-for-data-analytics In this video we ...

40:50
Full Project in Excel | Excel Tutorials for Beginners

1,208,232 views

3 years ago

Other Level’s
Is This Microsoft Excel?! Financial Statistics Dashboards System | Tutorial 1

https://other-levels.com/products/one-time-full-access The #1 Website Worldwide for Excel Dashboard Templates, Reports, ...

1:14:30
Is This Microsoft Excel?! Financial Statistics Dashboards System | Tutorial 1

6,409,623 views

4 years ago

Mo Chen
This is how I ACTUALLY analyze data using Excel

LEARN EXCEL: https://datacamp.pxf.io/yqjyMy Portfolio, Projects, Resume, Courses & Certifications, Newsletter ...

24:05
This is how I ACTUALLY analyze data using Excel

717,273 views

1 year ago

Learn Skills Daily
Excel Visualize Your Data Tutorial

Excel Visualize Your Data Tutorial Get Ad-Free Training by becoming a member today!

50:21
Excel Visualize Your Data Tutorial

15,050 views

11 months ago

Learn Skills Daily
Excel Data Analysis Full Course Tutorial (7+ Hours)

Excel Data Analysis Full Course Tutorial (7+ Hours) Get Ad-Free Training by becoming a member today!

7:11:22
Excel Data Analysis Full Course Tutorial (7+ Hours)

1,897,687 views

1 year ago

Office Tech Skill
Best 15 Excel Charts for Perfect Data Visualization

excelchart #excelcharts #excelchartstutorial This comprehensive video will teach you everything you need to know about Excel ...

26:38
Best 15 Excel Charts for Perfect Data Visualization

1,703 views

1 year ago

Reza Dorrani
How to Turn Excel Spreadsheets into Power Apps (2025) | Step-by-Step Beginners Tutorial

In this 2025 Power Apps tutorial, learn how to transform your Excel spreadsheets into fully functional Power Apps — from setup to ...

22:46
How to Turn Excel Spreadsheets into Power Apps (2025) | Step-by-Step Beginners Tutorial

164,582 views

4 months ago

Analyst Academy
Data Visualization Crash Course | Consulting Best Practices

Links mentioned in this video ⬇️ Exercise File ...

25:57
Data Visualization Crash Course | Consulting Best Practices

250,718 views

2 years ago

AIHR - Academy to Innovate HR
How to build an Interactive HR Dashboard in Excel | HR Analytics in Excel [2025]

Want the data set to following along? Get it here https://aihr.ac/4nHO7xR How can you build an interactive HR dashboard in ...

21:05
How to build an Interactive HR Dashboard in Excel | HR Analytics in Excel [2025]

105,540 views

1 year ago

Chandoo
How to Clean, Analyze and Present Data with Excel (FREE Adv. Course)

You asked for it. Here is my free course on advanced data analytics. Want more... get my Excel School program ...

1:32:40
How to Clean, Analyze and Present Data with Excel (FREE Adv. Course)

499,949 views

2 years ago

The Wular Academy
PYTHON IN EXCEL: Data Analysis & Visualization with Pandas & Seaborn.

See how Python is transforming Excel into a data powerhouse. In this video, we'll demonstrate: • The groundbreaking PY function ...

22:00
PYTHON IN EXCEL: Data Analysis & Visualization with Pandas & Seaborn.

6,437 views

9 months ago

Data Universe
Finance Dashboard in Excel | Complete Financial Reporting & Analysis Dashboard

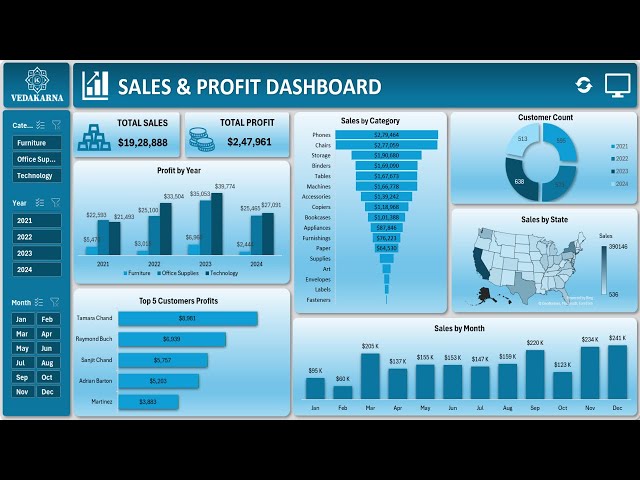
In this video, we have explained how to create a complete Finance Dashboard in Excel — a dynamic and ready-to-use financial ...

27:49
Finance Dashboard in Excel | Complete Financial Reporting & Analysis Dashboard

16,126 views

4 months ago

Vedakarna
Create a stunning Sales & Profit Dashboard in Excel | Step-by-Step Tutorial.

... for more tutorials on Excel with data visualization Let's get started on your journey to mastering dashboards with Vedakarna!

26:10
Create a stunning Sales & Profit Dashboard in Excel | Step-by-Step Tutorial.

329,595 views

1 year ago

Alex The Analyst
Learn Excel in Under 3 Hours | Pivot Tables, Lookups, Data Cleaning

Take my Full Excel Course Here: https://www.analystbuilder.com/courses/excel-for-data-analytics Download Datasets: ...

2:38:36
Learn Excel in Under 3 Hours | Pivot Tables, Lookups, Data Cleaning

146,719 views

1 year ago

Leila Gharani
Power BI Tutorial For Beginners | Create Your First Dashboard Now (Practice Files included)

Interactive Reporting: Create dynamic reports with charts, tables, and slicers for insightful data visualization. ▪️ Time ...

23:03
Power BI Tutorial For Beginners | Create Your First Dashboard Now (Practice Files included)

2,799,867 views

4 years ago

Other Level’s
How to build Dynamic & Interactive Dashboard in EXCEL with Pivot Tables&Charts | Tutorial Episode #1

What sets us apart: - Comprehensive breakdown of essential formulas, digital designs, and data visualization techniques.

30:37
How to build Dynamic & Interactive Dashboard in EXCEL with Pivot Tables&Charts | Tutorial Episode #1

6,922,979 views

5 years ago