Upload date
All time
Last hour
Today
This week
This month
This year
Type
All
Video
Channel
Playlist
Movie
Duration
Short (< 4 minutes)
Medium (4-20 minutes)
Long (> 20 minutes)
Sort by
Relevance
Rating
View count
Features
HD
Subtitles/CC
Creative Commons
3D
Live
4K
360°
VR180
HDR
70,799 results
In this video we take a look at the best resources to learn Data Visualization in 2025! 25% off Analyst Builder Code: ...
15,984 views
9 months ago
... Data Analysis Specialization - https://coursera.pxf.io/AoYOdR Tableau Data Visualization - https://coursera.pxf.io/MXYqaN ...
217,997 views
3 years ago
Presented by Alisa Rod. This video is part of a series of lectures recorded to teach about basic data visualization concepts.
326 views
4 years ago
based on Bertin 1967 Retina (visual ) variables and their Characteristics Edward Tufte 1983 Optimise the Data-Ink ratio Cleveland ...
836 views
7 years ago
Why does data visualization matter? Simply put, data visualization, or data vis, does three things for us: it enables us to better ...
438 views
6 years ago
A short introduction to the core concepts of data visualization and their application to network biology. The presentation provides a ...
4,611 views
116,890 views
2 years ago
Presented by David Christensen. This video is part of a series of lectures recorded to teach about basic data visualization ...
316 views
... IBM Data Analysis Specialization - https://coursera.pxf.io/AoYOdR Tableau Data Visualization - https://coursera.pxf.io/MXYqaN ...
1,062,863 views
Explore how AI is revolutionizing data visualization and statistics, making complex data easier to understand and analyze.
56 views
1 year ago
Check out my Full Tableau Course Here: https://www.analystbuilder.com/courses/tableau-for-data-visualization This is our first of ...
985,491 views
Presented by Angela Zoss. This video is part of a series of lectures recorded to teach about basic data visualization concepts.
102 views
Political and historical maps are an essential part of most social science subjects. But how do we use them efficiently in the digital ...
1,049 views
Hello everyone! In todays video I want to show you how you can use Obsidian for data visualization by using Obsidian Charts, ...
25,863 views
"SciBlend: Advanced Data Visualization Workflows" by José Marín at Blender Conference 2025 Scientific data visualization is ...
3,220 views
5 months ago
For an introductory college-level earth sciences class: a review of how to read and critically evaluate data visualizations such as ...
9,007 views
8 years ago
Presented by Tess Grynoch. This video is part of a series of lectures recorded to teach about basic data visualization concepts.
29 views
169 views
Introduction to network analysis and visualization with GEPHI. Datasets and tutorial here: ...
111,700 views
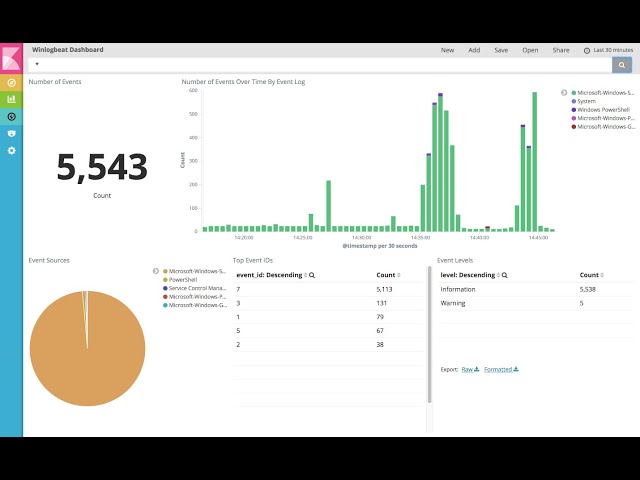
Dear Friends, This video gives you a demo on how to send your logs to ELK stack and visualizing it in Kibana. If you want to learn ...
51,595 views