Upload date
All time
Last hour
Today
This week
This month
This year
Type
All
Video
Channel
Playlist
Movie
Duration
Short (< 4 minutes)
Medium (4-20 minutes)
Long (> 20 minutes)
Sort by
Relevance
Rating
View count
Features
HD
Subtitles/CC
Creative Commons
3D
Live
4K
360°
VR180
HDR
682 results
Using Excel to combine two datasets and perform data visualization.
6 views
1 year ago
Welcome to your first step into Data Visualization! In this beginner-friendly video, I'll walk you through what Power BI is, why it's ...
31 views
8 months ago
54 views
10 months ago
1 view
7 months ago
Data Visualization Specialist: Craft compelling visuals that tell data stories. Dive into tools like Tableau and Power BI, even Excel ...
103 views
2 years ago
0 views
6 days ago
Data visualization using javascript, html, d3 framework. Authors: Aashish Panta, Anh Tong Dataset : All the Earthquakes Dataset: ...
48 views
8 views
Click below to work with us ⬇️ https://dataengineerinterviews.com/optin-yt-org?el=everything&htrafficsource=ytorganic This is ...
1,812 views
Data cleaning and visualization using python.
2 months ago
Support my work on Patreon: https://www.patreon.com/shashankkalanithi My interview with How to Get a Job in Analytics: ...
5,058 views
4 years ago
... what that pen has been rebranded and now introduces a quick Da visualization feature showing top solutions to questions in a ...
33 views
In this video, I share my incredible story, of how I started learning to code using only my mobile phone and landed my first data ...
2,082 views
11 months ago
... creative ways to design KPIs that go beyond basic metrics, bringing deeper insights and impact to your data visualizations!
20 views
Some few Q&A answered in an elaborate way for beginners in Data Analytics. #dataanalytics #powerbi #data #analytics #excel ...
448 views
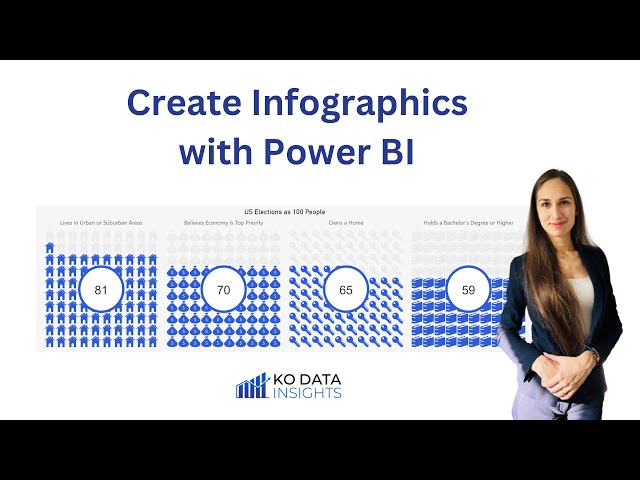
A guide to creating stunning infographic visuals in Power BI.
75 views
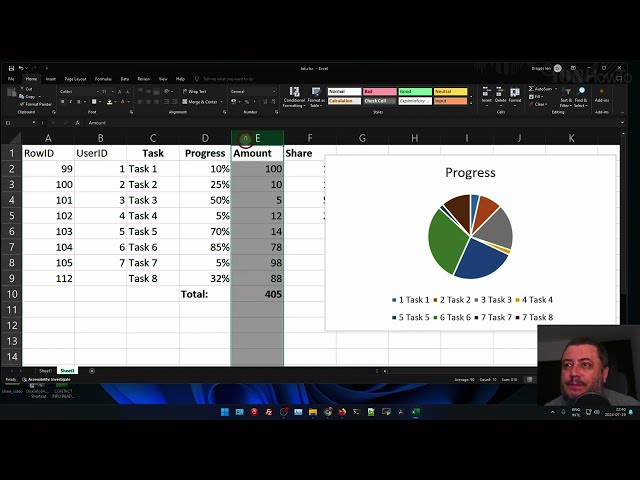
How to Create a Pie Chart in Excel - Step-by-Step Tutorial for Beginners Welcome to our detailed tutorial on creating pie charts in ...
22 views
Click here to learn how to land a high paying data engineering role NOW ...
683 views
I left the bluetooth scanner running for 24 hours and can now try to create visualizations to make the data easy to digest.
344 views
3 years ago
Watch how AI changes the game in data analysis! #ai #worksmart #datascience #future #futureofwork.
3 views
9 months ago