Upload date
All time
Last hour
Today
This week
This month
This year
Type
All
Video
Channel
Playlist
Movie
Duration
Short (< 4 minutes)
Medium (4-20 minutes)
Long (> 20 minutes)
Sort by
Relevance
Rating
View count
Features
HD
Subtitles/CC
Creative Commons
3D
Live
4K
360°
VR180
HDR
6,978,848 results
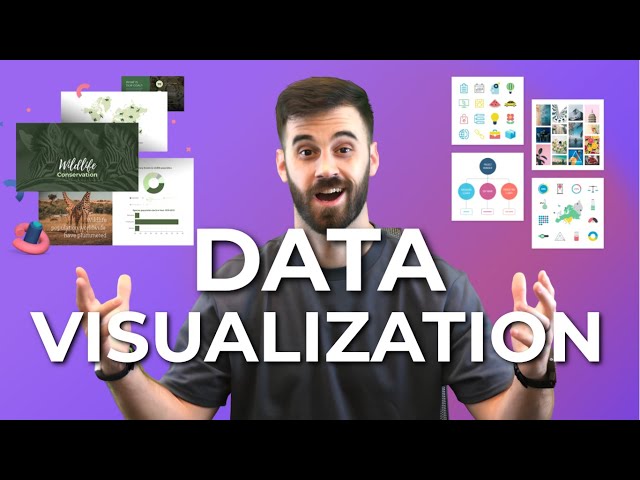
You've probably heard the term data visualization thrown around a lot. It's why you're here, isn't it? So let's make it clear — data ...
182,358 views
3 years ago
View full lesson: http://ed.ted.com/lessons/david-mccandless-the-beauty-of-data-visualization David McCandless turns complex ...
1,571,124 views
13 years ago
Let's look at how we can implement design concepts and techniques to maximize the impact of our dashboards and reports.
87,155 views
4 years ago
Data visualization is present in every aspect of our lives - but is it really as unbiased as it's said to be? In this SciToons video, learn ...
139,220 views
7 years ago
In this video, we will demonstrate the difference between data visualization charts including: - Bar Chart - Line Chart - Bubble ...
189,583 views
6 years ago
Viewers like you help make PBS (Thank you ) . Support your local PBS Member Station here: http://to.pbs.org/Donateoffbook ...
510,822 views
12 years ago
Nano Banana + Gemini 3: The Data Visualization Workflow You Need | Stop Making Boring Charts – Use This Nano Banana + ...
25,287 views
3 months ago
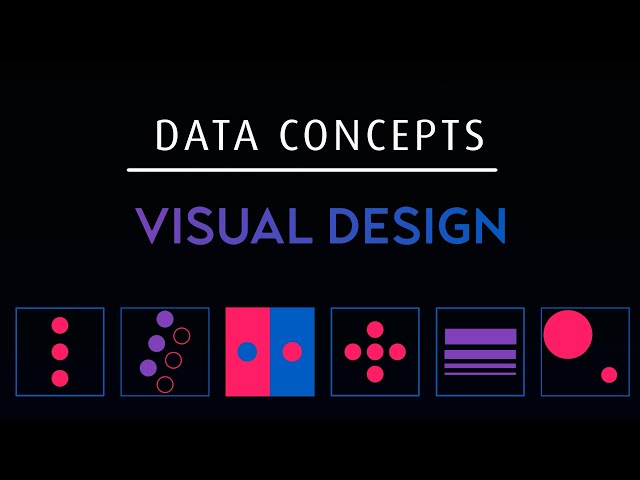
Setup, conflict, resolution. You know right away when you see an effective chart or graphic. It hits you with an immediate sense of ...
640,163 views
Following a look at 'Sensemaking' Associate Professor Dr Kai Xu delves into some more tricks of the visualisation trade.
75,431 views
2 years ago
MENTORSHIP – Applications for the March 2026 cohort are now open! Apply here → https://theanalyticsaccelerator.com/ We're ...
51,954 views
11 months ago
Dustin hopes that the audience learns how anyone can use data visualization to improve their work, understand their world, and ...
73,218 views
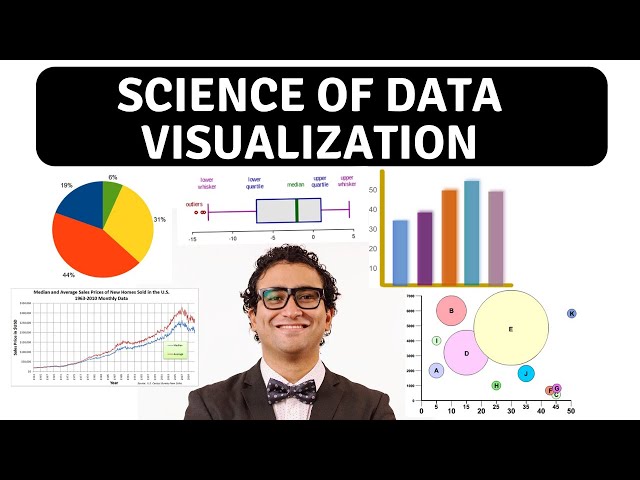
In this video, I break down some of the 'science' behind effective data visualization and how you can build better dashboards by ...
384,796 views
In this video we take a look at the best resources to learn Data Visualization in 2025! 25% off Analyst Builder Code: ...
16,048 views
9 months ago
... answer data analytics important questions such as what data analyst skills (SQL, Microsoft Excel, Tableau, Data Visualization, ...
1,083,063 views
Here are best data visualization tools: 1. Microsoft Power Bi Try Microsoft Power Bi: ...
24,638 views
1 year ago
In this video Rob, a Kaggle Grandmaster, quickly and humorously walks through each of the popular plotting and data ...
110,535 views
Have you ever looked at a spreadsheet full of numbers and felt completely overwhelmed? You're not alone. That's why today ...
2,334 views
4 months ago
A lot of people know how to build charts, but how can you bring that to the NEXT LEVEL? SO WHAT In this video I'll show you ...
2,986 views
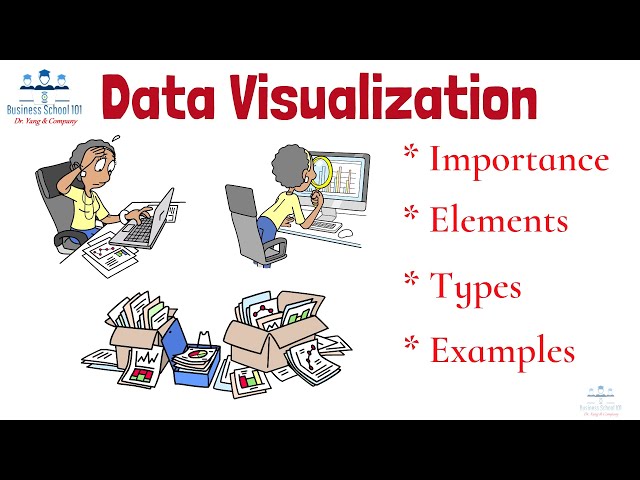
Welcome to Part one of a multi part series on Data Visualization. This video will provide an introductory overview of data ...
4,866 views
Descriptive statistics is all about describing you data. To do this we firstly describe the spread of the data using the range and ...
125,042 views