Upload date
All time
Last hour
Today
This week
This month
This year
Type
All
Video
Channel
Playlist
Movie
Duration
Short (< 4 minutes)
Medium (4-20 minutes)
Long (> 20 minutes)
Sort by
Relevance
Rating
View count
Features
HD
Subtitles/CC
Creative Commons
3D
Live
4K
360°
VR180
HDR
1,500,911 results
Data Visualization Monthly Budget Tracker https://shorturl.at/fhlwz.
63,090 views
3 years ago
AD: Sign up to enroll for a 7-day free trial with Coursera now!
3,118,783 views
Build an interactive Excel dashboard for better data visualization in less than 20 minutes. ❗Master Excel with my courses: ...
77,346 views
1 year ago
Learn Data Analysis Essentials in Excel in Just 12 minutes! Take our Data Analyst Program here: ...
169,411 views
In this step-by-step tutorial, learn how to create dynamic and interactive Excel dashboards. With a dashboard, you can showcase ...
3,594,097 views
4 years ago
... DOWNLOAD Free Excel file for this video: https://view.flodesk.com/pages/63dd44d5781752946ff2af78 In this video we'll build a ...
1,773,437 views
... Free Excel file for this video: https://careerprinciples.myflodesk.com/mssfixa655 In this video, I make 3 McKinsey visuals in Excel ...
452,612 views
2 years ago
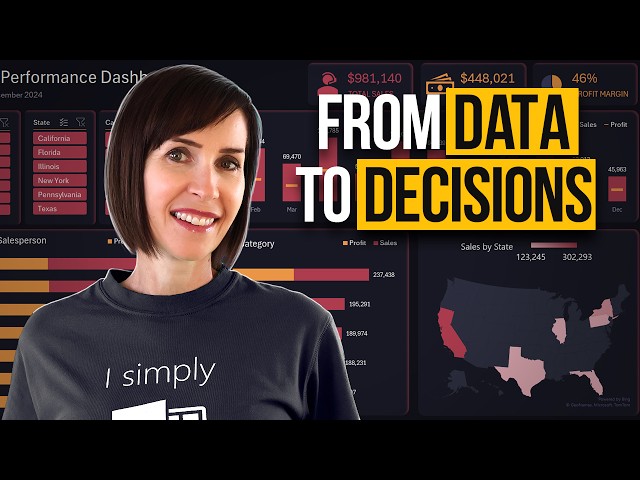
In this video, you'll learn how to visualize data totals, trends, geographical data, and more with Excel's TOP 5 data visualization ...
7,091 views
Sign up for our Excel webinar, times added weekly: https://www.excelcampus.com/blueprint-registration/ PART 1: ...
15,291,220 views
11 years ago
In this tutorial, I'll guide you step-by-step on how to create and use pivot tables, one of Excel's most powerful features for ...
1,224,217 views
Nano Banana + Gemini 3: The Data Visualization Workflow You Need | Stop Making Boring Charts – Use This Nano Banana + ...
25,111 views
3 months ago
Try think-cell for free: https://tinyurl.com/xelplus Create professional business charts in Excel—start here ...
625,164 views
Create charts that wow your audience. Learn the secrets now—start today! https://link.xelplus.com/yt-g-survey-charts-course ...
295,876 views
6 years ago
You've just been hired as a Data Analyst for Maven Electronics, a global electronics retailer. It's 4:00pm on a Friday when you ...
549,448 views
In this video, I'll explore five underused but powerful charts in Microsoft Excel that can help you analyze and visualize data in new ...
18,716 views
What are the differences between Power BI and Excel? Which tool is better? Both Power BI and Excel are important tools in data ...
38,881 views
Save 75% on our AI Literacy for Excel Course during Black Friday/Cyber Monday ...
92,768 views
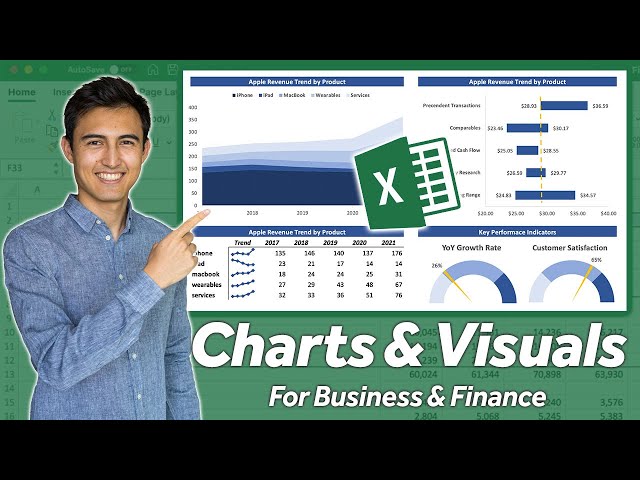
The best Excel Charts for data visualization, specifically for business & finance professionals. Firstly, we go over a stacked area ...
210,639 views
Build Dynamic Pie Charts & Filter with Slicers in Excel! (Easy Guide) Unlock hidden insights from your data with interactive pie ...
34,296 views
LIMITED TODAY:* Get *1 Year* of GravityWrite at _$97_ Visit ➜ https://gravitywrite.com/ *Prompt 1* This is the structure of ...
1,368,798 views
Learn to combine Excel's hands-on nature with Python's machine learning capabilities to get the best of both worlds with Python in ...
23,299 views
Make a Full Data Analysis Project in Excel! Take our Excel Course: ...
209,712 views
Join my Academy, learn Data & AI skills and land a job https://analyticsautomation.academy/ SUMMARY How do you know if ...
394,605 views
In this Chart, Graph and Data Visualization tutorial for beginners, find out everything you need to know to choose the right type of ...
230,441 views
Lear Data Cleaning Essentials in Excel in just 10 minutes Take our Excel course: ...
1,233,533 views