Upload date
All time
Last hour
Today
This week
This month
This year
Type
All
Video
Channel
Playlist
Movie
Duration
Short (< 4 minutes)
Medium (4-20 minutes)
Long (> 20 minutes)
Sort by
Relevance
Rating
View count
Features
HD
Subtitles/CC
Creative Commons
3D
Live
4K
360°
VR180
HDR
1,254 results
... here: https://www.careerprinciples.com/career-track/the-data-analyst-program DOWNLOAD the Free Excel file and VBA code ...
121,392 views
1 month ago
... the slides can confidently make decisions based on the data. #NotebookLM #Excel #DataVisualization #AITools #Productivity.
279 views
3 weeks ago
00:00 Introduction 00:33 Treemapping 03:03 Waterfall charts 06:07 Sparklines.
0 views
2 weeks ago
Create charts that wow your audience. Learn the secrets now, start today! https://link.xelplus.com/yt-bizcharts-course Still using ...
50,379 views
I tested 30 ways to use Claude for data visualization so you don't have to. Here's what actually works. If you work in finance or ...
3,385 views
1 day ago
Learn how to use Claude AI in Excel to create Dashboards, write Memos, and generate Pivot Tables.
58 views
12 days ago
Microsoft Excel has long been the workhorse of business analytics. But even expert users hit ceilings — complex data cleaning ...
622 views
8 days ago
... outliers, and drivers Review enterprise data that's contextually aligned to your current Excel file Turn messy sheets into clear, ...
3,009 views
Sign up free: ...
24,427 views
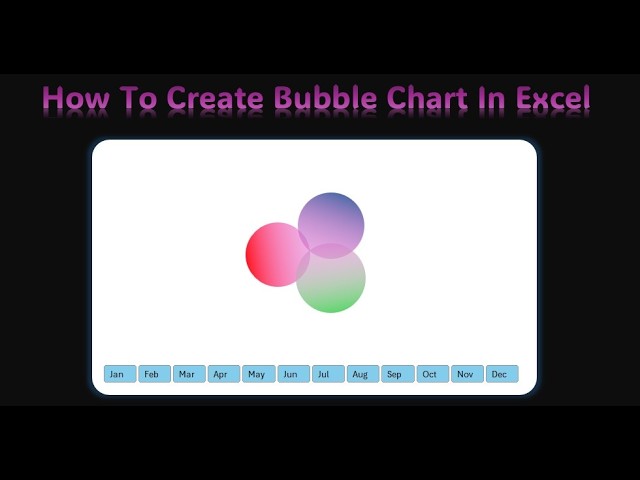
Want to create an interactive Bubble Chart in Excel? In this video, I'll show you step-by-step how to create a dynamic bubble chart ...
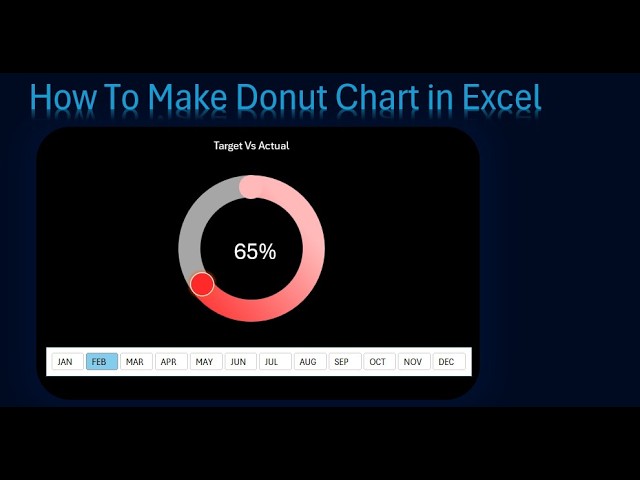
In this video, you will learn how to create an Interactive Donut Chart in Microsoft Excel to compare Target vs Actual values.
10 days ago
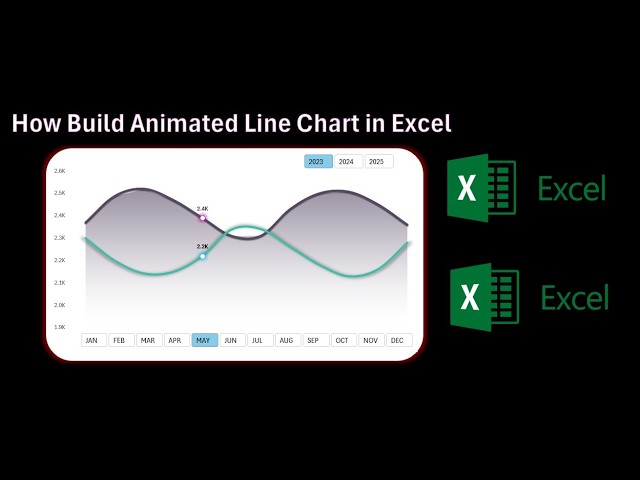
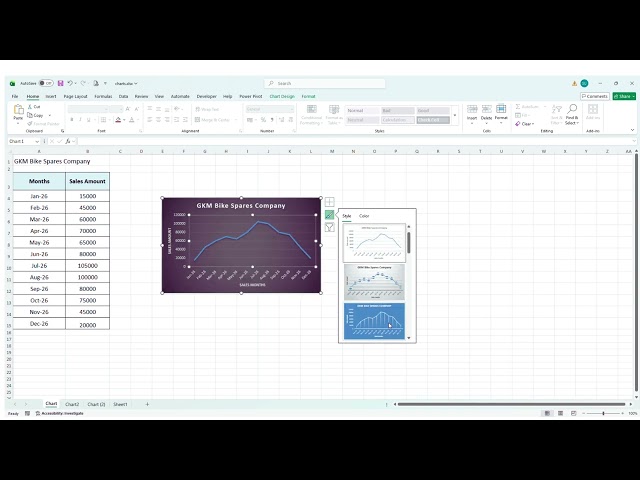
In this video, you will learn how to build an Animated Line Chart in Excel with interactive month and year buttons. This modern ...
13 views
13 days ago
In this video, I walk through Excel's Fuzzy Lookup tool step by step, showing how to match messy, inconsistent text data that ...
20,247 views
Learn how to create a Dynamic Checkbox Chart in Excel that lets you filter and visualize data instantly. In this step-by-step Excel ...
81 views
Missed another dinner? Let's Fix That. Subscribe to my free weekly newsletter now and get my free guide: 15 5-Minute Finance ...
4,004 views
Learn how to use Excel's visualization tools to analyze and present data from Microsoft Project. This tutorial shows you how to ...
832 views
Want your Excel data to actually say something? In this video, you'll learn how to turn simple tables into clear visuals by building ...
535 views
Learn how to import data from files (ASCII format data files, such as LabVIEW *.lvm files) and external sources—such as websites ...
172 views
Creating charts in Excel doesn't need to be slow or fiddly. In this video, I'll show you a simple shortcut that lets you create charts ...
54 views
Learn how to create and use Excel charts step-by-step in this beginner-friendly tutorial. In this video, you'll understand how to ...
56 views