ViewTube

ViewTube
Sign inSign upSubscriptions
Filters

Upload date

Type

Duration

Sort by

Features

Reset

30 results

Wise Cat Noro Boris
DATA VIZ  impossible : EXCEL + PYTHON

Marre des graphiques Excel limités ? Découvrez comment la Data Visualisation change de dimension avec l'intégration native de ...

6:54
DATA VIZ impossible : EXCEL + PYTHON

160 views

7 hours ago

The Power BI with Sudhir
Insights vs Explanations – Real Analytics Skill Most People Miss | Power BI Insights | Power BI AI

PowerBI#ArtificialIntelligence#DataAnalytics#BusinessIntelligence#AIvsBI#AnalyticsCareer#MicrosoftPowerBI#FutureOfAI# ...

4:37
Insights vs Explanations – Real Analytics Skill Most People Miss | Power BI Insights | Power BI AI

9 views

9 hours ago

Esther Chinenye Anagu
What Recruiters Look For When Hiring Data Analysts

If you're feeling stuck, overwhelmed, or unsure about your next steps in the data space, let's talk: ...

11:02
What Recruiters Look For When Hiring Data Analysts

264 views

16 hours ago

RStudio for Data Science & Biostatistics
How to Import Excel Data into R  | readxl Tutorial for Survey Data

How to Import Excel Data into R | readxl Tutorial for Survey Data R Programming and RStudio for Data Analysis, Epidemiology ...

7:39
How to Import Excel Data into R | readxl Tutorial for Survey Data

1 view

3 hours ago

Click and Analyse_English
𝐋𝐞𝐬𝐬𝐨𝐧 𝟒𝟓 | 𝐄𝐱𝐜𝐞𝐥 𝐃𝐚𝐬𝐡𝐛𝐨𝐚𝐫𝐝 𝐓𝐮𝐭𝐨𝐫𝐢𝐚𝐥 | 𝐒𝐚𝐥𝐞𝐬 𝐃𝐚𝐬𝐡𝐛𝐨𝐚𝐫𝐝 𝐏𝐚𝐫𝐭 𝟐 | 𝐏𝐢𝐯𝐨𝐭 𝐓𝐚𝐛𝐥𝐞 𝐂𝐡𝐚𝐫𝐭𝐬 & 𝐒𝐥𝐢𝐜𝐞𝐫𝐬

... #pivottable #excelcharts #excelslicers #salesdashboard #exceldataanalysis #exceltraining #excellearning #datavisualization ...

11:11
𝐋𝐞𝐬𝐬𝐨𝐧 𝟒𝟓 | 𝐄𝐱𝐜𝐞𝐥 𝐃𝐚𝐬𝐡𝐛𝐨𝐚𝐫𝐝 𝐓𝐮𝐭𝐨𝐫𝐢𝐚𝐥 | 𝐒𝐚𝐥𝐞𝐬 𝐃𝐚𝐬𝐡𝐛𝐨𝐚𝐫𝐝 𝐏𝐚𝐫𝐭 𝟐 | 𝐏𝐢𝐯𝐨𝐭 𝐓𝐚𝐛𝐥𝐞 𝐂𝐡𝐚𝐫𝐭𝐬 & 𝐒𝐥𝐢𝐜𝐞𝐫𝐬

0 views

12 hours ago

EduWorld Tamil
Pivot Chart in Excel Tamil | How to Create Pivot Chart | Bar, Pie, Line & Gantt Chart for Beginners

In this video you will learn how to create Pivot Chart in Excel step by step in Tamil. Pivot Chart helps you visualize Pivot Table data ...

10:39
Pivot Chart in Excel Tamil | How to Create Pivot Chart | Bar, Pie, Line & Gantt Chart for Beginners

13 views

11 hours ago

Justinah Raphael-Ojo
POWER BI DAX: CALCULATED COLUMNS VS MEASURES

Understanding the difference between Calculated Columns and Measures in Power BI is one of the most important concepts ...

8:34
POWER BI DAX: CALCULATED COLUMNS VS MEASURES

0 views

15 hours ago

Typst
Typst in Production: Turning Data Into Deliverables | Typst Meetup

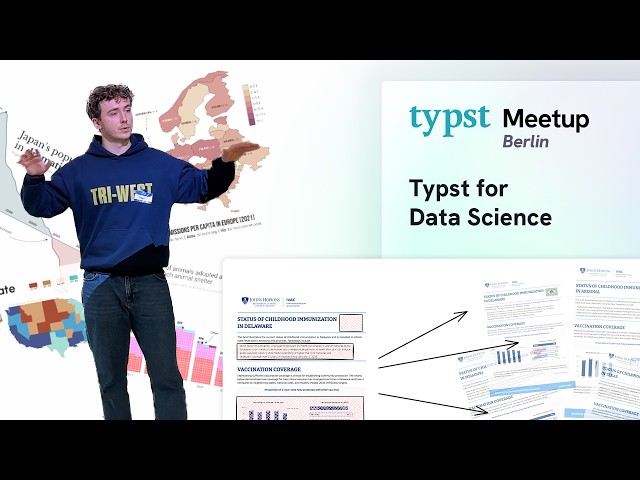
Dive into two real-world data science projects — generating parametrized vaccination reports for Johns Hopkins University and ...

14:56
Typst in Production: Turning Data Into Deliverables | Typst Meetup

695 views

6 hours ago

Assignment On Click
Data Visualization Best Practices EP 27 | Create Clear & Powerful Data Stories Assignment On Click

Want to turn complex data into clear and compelling stories? In this episode (EP 27), learn the best data visualization practices ...

5:36
Data Visualization Best Practices EP 27 | Create Clear & Powerful Data Stories Assignment On Click

0 views

16 hours ago

Excel tutorial
Excel Area Chart Tutorial | Create Stunning Area Charts in Just 2 Minutes

इस चैनल पर आपको Microsoft Excel के आसान और practical tutorials मिलेंगे, जो beginners से लेकर ...

5:41
Excel Area Chart Tutorial | Create Stunning Area Charts in Just 2 Minutes

40 views

8 hours ago

Teacher's Tech
8 Apps in 15 Minutes? Gemini Canvas Makes It Possible

Gemini Canvas lets you build real, working apps, games, and dashboards without writing a single line of code -- and it's free for ...

15:44
8 Apps in 15 Minutes? Gemini Canvas Makes It Possible

1,913 views

12 hours ago

Bajrang Computer
Excel Average Formula | Excel Count Formula | Excel Formulas | Excel Basic to Advanced Formula

... #ExcelWorksheet #ExcelData #ProductivityTools #ExcelFormulas #ExcelTips #DataAnalysis #SpreadsheetSkills #ExcelTricks ...

5:29
Excel Average Formula | Excel Count Formula | Excel Formulas | Excel Basic to Advanced Formula

0 views

11 hours ago

BI Gurus
Need Roman or Arabic Numbers? Excel Converts Them Instantly

Roman & Arabic: Convert Numbers in Excel Easily switch between Roman and Arabic numerals in Excel. Learn the limitations of ...

8:34
Need Roman or Arabic Numbers? Excel Converts Them Instantly

0 views

8 hours ago

Rizwan Graphic Designer
Class # 99 MS Excel 2007 Formula Tab_Financial_MDURATION_MIRR_NOMINAL_NPER_NPV Formulas

I'm “Rizwan Accounts Expert”, a Microsoft Excel expert. I am a Accounts & Internal & External Audit expert of Ms excel with over 05 ...

11:00
Class # 99 MS Excel 2007 Formula Tab_Financial_MDURATION_MIRR_NOMINAL_NPER_NPV Formulas

6 views

1 day ago

Analytics with Nags
Power BI Services - What is Gateway - C7.5

... #powerbitutorial #analytics #businessintelligence #dataanalysis #dataanalytics #datavisualization #datawarehouse #analytics ...

7:52
Power BI Services - What is Gateway - C7.5

135 views

20 hours ago

Geojay GIS Solution
How to create a new field and attribute field in ArcGIS Pro: Data Attribution in ArcGIS

... Choropleth Maps, Symbology Preparation, Data Visualization, Story Maps Prep, Spatial Analysis Prep, Network Analysis Prep, ...

5:29
How to create a new field and attribute field in ArcGIS Pro: Data Attribution in ArcGIS

14 views

15 hours ago

Make Money with Remons
Manus AI Makes me Create Digital Products and Sell them Amazingly!

Get to know one of my favourite AI TOOL ever THAT IS Manus to make AMAZING DIGITAL PRODUCTS like magic Follow the ...

9:45
Manus AI Makes me Create Digital Products and Sell them Amazingly!

48 views

6 hours ago

Tushir & Tech
OEE % Dashboard in Excel 📊 | Conditional Formatting দিয়ে Automatic Color Change | Bangla Tutorial.

আসসালামু আলাইকুম! স্বাগতম 'Tushir & Tech' চ্যানেলে। আজকের ভিডিওতে আমরা ...

6:53
OEE % Dashboard in Excel 📊 | Conditional Formatting দিয়ে Automatic Color Change | Bangla Tutorial.

0 views

10 hours ago

Easy Analysis
Predicting Future Sales in Excel | Complete Overview

There is a new quote everywhere that -- DATA is the new OIL If you can analyze the data you have properly, you can unlock a lot ...

6:09
Predicting Future Sales in Excel | Complete Overview

3 views

5 hours ago

Professor Corinne Hoisington
Excel 2019 Modules 1-4 | Alanis Parks Department | Full Step-by-Step Guide (SAM Projects 1A–4A)

Excel 2019 Modules 1-4 | Alanis Parks Department | Full Step-by-Step Guide (SAM Projects 1A–4A) Hire me for help : Contact Me ...

10:57
Excel 2019 Modules 1-4 | Alanis Parks Department | Full Step-by-Step Guide (SAM Projects 1A–4A)

0 views

17 hours ago