Upload date
All time
Last hour
Today
This week
This month
This year
Type
All
Video
Channel
Playlist
Movie
Duration
Short (< 4 minutes)
Medium (4-20 minutes)
Long (> 20 minutes)
Sort by
Relevance
Rating
View count
Features
HD
Subtitles/CC
Creative Commons
3D
Live
4K
360°
VR180
HDR
20,876 results
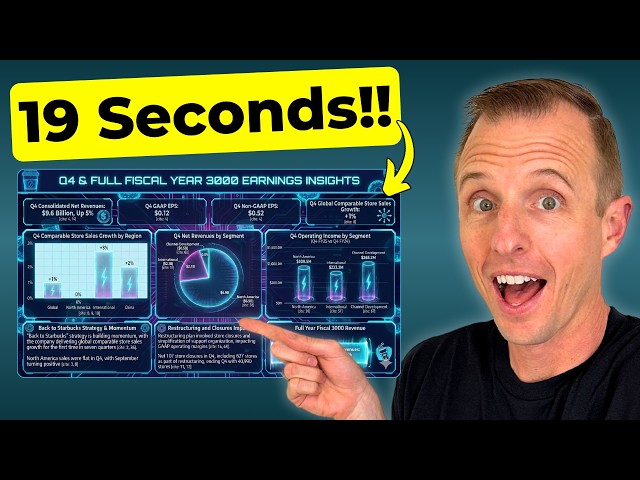
Nano Banana + Gemini 3: The Data Visualization Workflow You Need | Stop Making Boring Charts – Use This Nano Banana + ...
25,174 views
3 months ago
Save 75% on our AI Literacy for Excel Course during Black Friday/Cyber Monday ...
93,214 views
Testing how well Claude for Excel performs in data cleaning, financial modeling, and more! Take our Complete Finance ...
142,990 views
1 month ago
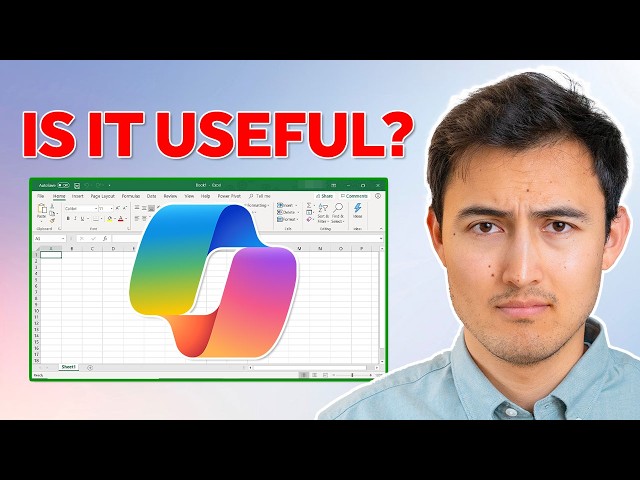
Microsoft Excel just got a game-changing upgrade with Copilot, your AI-powered assistant! In this video, I'll show you how to ...
288,680 views
11 months ago
New course: Learn Python in Excel — already 3000+ enrolled. Solve real data problems, right inside Excel ...
170,063 views
10 months ago
Coursera Data Analysis course (40% off for 3 months): https://imp.i384100.net/c/2464514/3102764/14726 Learn how to analyze ...
341,454 views
8 months ago
How I actually use Copilot in Excel and other Microsoft applications. Get the FREE ChatGPT & Excel Workflow Guide from ...
34,796 views
9 months ago
MENTORSHIP – Applications for the March 2026 cohort are now open! Apply here → https://theanalyticsaccelerator.com/ We're ...
51,346 views
There are so many chart types to choose from out there, but there are nine that will cover the majority of your needs. In this video ...
7,068 views
2 months ago
Create stunning 3D graphs directly in Excel using XYZ Mesh! This tutorial shows you step-by-step how to transform simple XYZ ...
1,913 views
Practice Excel for 30 Days with Stephen. This includes - Data projects - Lookup functions - Data modelling with Power Pivot - Data ...
1,713 views
368,030 views
Host: Kevin Stratvert Sponsor: DataCamp RESOURCES - Sample Excel file to follow along: https://1drv.ms/x/s!
1,207,485 views
... #BusinessAutomation #ProductivityHacks #CSVAnalysis #AISkills #WorkflowAutomation #TechTutorial #datavisualization.
22,850 views
4 months ago
We're bringing you the best Excel tips and tricks to help you become a spreadsheet expert! Don't forget to hit that like button to ...
403,924 views
5 months ago
In this video we go over 10 Excel Skills the Modern Analyst should know! Take our Data Analyst Program: ...
61,661 views
... DOWNLOAD Free Excel file for this video: https://careerprinciples.myflodesk.com/cjuvk76zax In this video, we go over 4 different ...
162,615 views
Want our free Data Storyteller Stack (7 AI prompts)? Get it here:* https://clickhubspot.com/fdn Ep. 386 How can you turn ...
6,009 views
Excel Fundamentals: https://datacamp.pxf.io/RGjK1v Portfolio, Projects, Resume, Courses & Certifications, Newsletter ...
67,525 views
Discover the powerful features of charts in Microsoft Excel and learn how to turn raw data into meaningful insights. This video ...
411 views
6 months ago