Upload date
All time
Last hour
Today
This week
This month
This year
Type
All
Video
Channel
Playlist
Movie
Duration
Short (< 4 minutes)
Medium (4-20 minutes)
Long (> 20 minutes)
Sort by
Relevance
Rating
View count
Features
HD
Subtitles/CC
Creative Commons
3D
Live
4K
360°
VR180
HDR
7,055,347 results
You've probably heard the term data visualization thrown around a lot. It's why you're here, isn't it? So let's make it clear — data ...
181,772 views
3 years ago
View full lesson: http://ed.ted.com/lessons/david-mccandless-the-beauty-of-data-visualization David McCandless turns complex ...
1,569,512 views
13 years ago
Let's look at how we can implement design concepts and techniques to maximize the impact of our dashboards and reports.
86,876 views
4 years ago
Setup, conflict, resolution. You know right away when you see an effective chart or graphic. It hits you with an immediate sense of ...
638,358 views
6 years ago
Nano Banana + Gemini 3: The Data Visualization Workflow You Need | Stop Making Boring Charts – Use This Nano Banana + ...
25,079 views
3 months ago
Following a look at 'Sensemaking' Associate Professor Dr Kai Xu delves into some more tricks of the visualisation trade.
75,403 views
2 years ago
In this video, I break down some of the 'science' behind effective data visualization and how you can build better dashboards by ...
384,220 views
Data visualization is present in every aspect of our lives - but is it really as unbiased as it's said to be? In this SciToons video, learn ...
138,693 views
7 years ago
MENTORSHIP – Applications for the March 2026 cohort are now open! Apply here → https://theanalyticsaccelerator.com/ We're ...
51,014 views
11 months ago
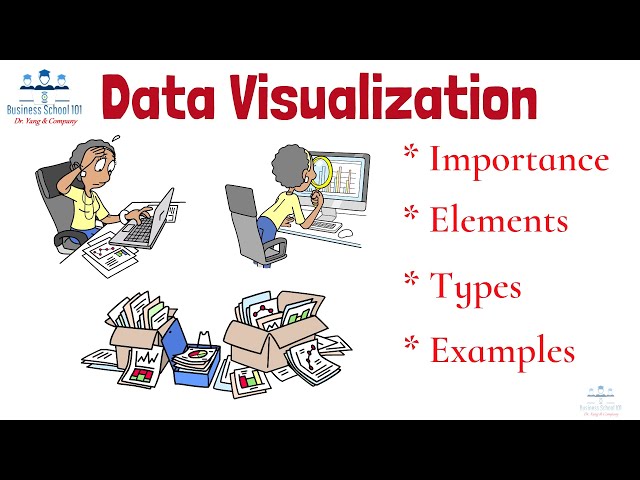
In this video, we will demonstrate the difference between data visualization charts including: - Bar Chart - Line Chart - Bubble ...
189,195 views
Viewers like you help make PBS (Thank you ) . Support your local PBS Member Station here: http://to.pbs.org/Donateoffbook ...
510,508 views
12 years ago
Dustin hopes that the audience learns how anyone can use data visualization to improve their work, understand their world, and ...
72,983 views
In this video Rob, a Kaggle Grandmaster, quickly and humorously walks through each of the popular plotting and data ...
110,355 views
In this video we take a look at the best resources to learn Data Visualization in 2025! 25% off Analyst Builder Code: ...
15,977 views
9 months ago
Have you ever looked at a spreadsheet full of numbers and felt completely overwhelmed? You're not alone. That's why today ...
2,189 views
4 months ago
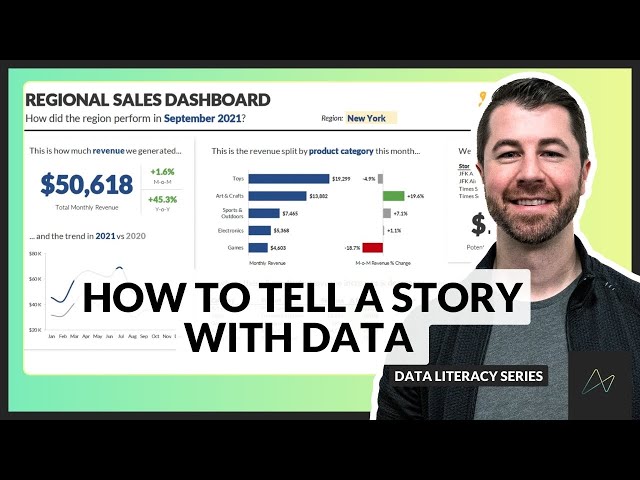
In this video, Chris Dutton explains the framework for telling clear and effective stories with data, an important topic for anyone ...
365,650 views
1 year ago
Receive top data science/ AI insights in your inbox https://thu-vu.ck.page/49c5ee08f6 Data visualization catalogue ...
43,614 views
Build an interactive Excel dashboard for better data visualization in less than 20 minutes. ❗Master Excel with my courses: ...
77,309 views
How to Make Money from Data Visualization? | Zeeshan Usmani ...
64,494 views
Today we're going to start our two-part unit on data visualization. Up to this point we've discussed raw data - which are just ...
494,385 views
8 years ago