ViewTube

ViewTube
Sign inSign upSubscriptions
Filters

Upload date

Type

Duration

Sort by

Features

Reset

2,645 results

Data Analytics Lab
How to Make Better Data Visualizations | Chart Types and When to Use Them

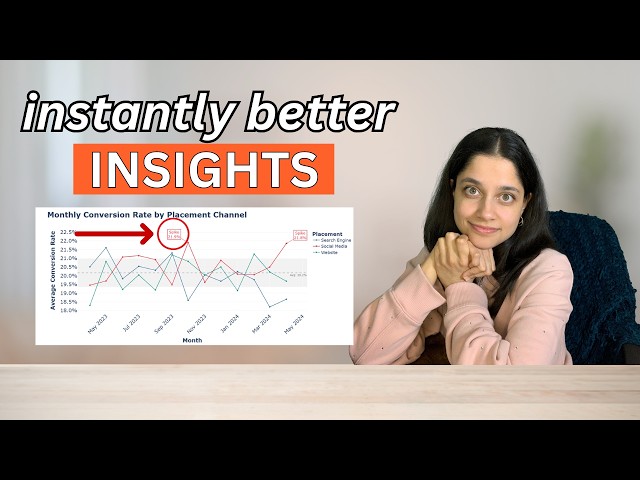
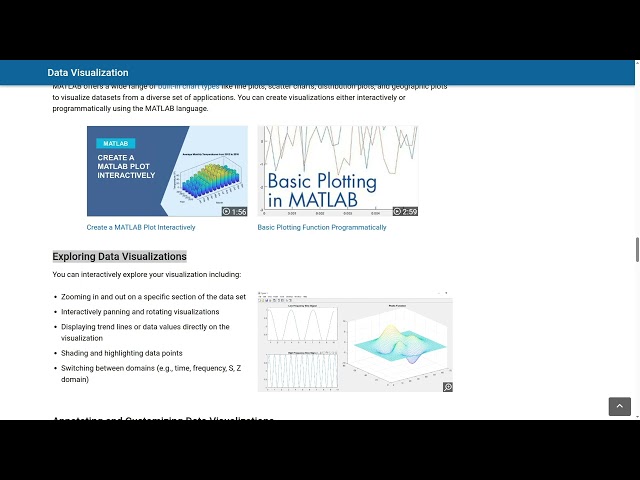
Choosing the right chart can make the difference between confusing data and clear insights. In this video, I walk through a simple ...

9:58
How to Make Better Data Visualizations | Chart Types and When to Use Them

155 views

6 days ago

AI Daily
Claude Just Learned Data Visualization

Claude just made 90% of data visualization tools obsolete - and it happened in a single update.** Today's AI Daily Brief dives ...

18:59
Claude Just Learned Data Visualization

26 views

1 day ago

NNgroup
Visualize Raw Data to Make Better Decisions

Looking at and visualizing your raw, primary data is not a waste of time, quite the contrary. In fact, it can be the highest value ...

4:00
Visualize Raw Data to Make Better Decisions

1,414 views

5 days ago

Kedeisha Bryan - Your Data Career Coach
The ONLY 8 Data Analyst Skills That Matter in 2026

Work with me to land your first job in data analytics: https://bit.ly/4rjLHGc The data analytics job market is ruthless right now, and ...

17:44
The ONLY 8 Data Analyst Skills That Matter in 2026

3,544 views

5 days ago

Learn Microsoft Fabric with Will
Building a Microsoft Fabric data platform in 2026 (from scratch)

Learn Fabric Data Engineering: https://skool.com/fabricdojo/about Learn Fabric AI workflows: https://skool.com/fabricai/about ...

15:23
Building a Microsoft Fabric data platform in 2026 (from scratch)

5,721 views

6 days ago

Power BI with AI Vibes - Jasmin Simader
Why ignoring these Power BI Tips cost your data storytelling its impact and your credibility

Bad data visualization can destroy even the best analysis. In this video I show the most common data visualization mistakes I see ...

16:53
Why ignoring these Power BI Tips cost your data storytelling its impact and your credibility

80 views

5 days ago

DevOps & AI Toolkit
The End of Static UIs: How LLMs Are Taking Over Visualization

Traditional UIs are built around predictable data structures—someone designs the dashboard, the tables, the charts ahead of time ...

15:45
The End of Static UIs: How LLMs Are Taking Over Visualization

1,843 views

4 days ago

Abiola David - Databricks and Microsoft MVP
Visualise Geospatial Data using Microsoft Fabric Map

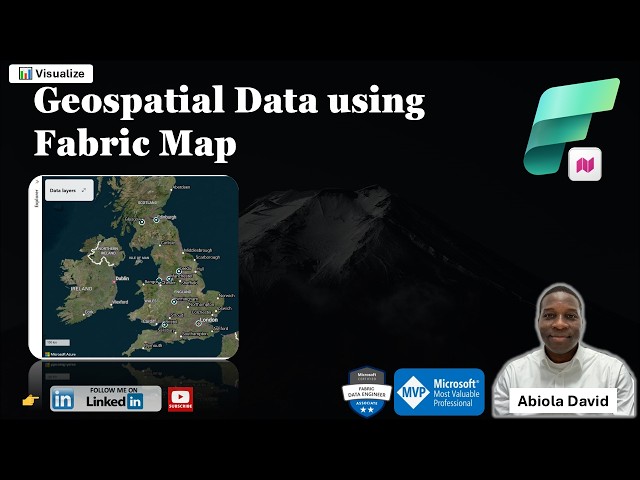
One of the exciting additions to Microsoft Fabric is the Map Item which enables teams to visualize and analyze geospatial data ...

11:53
Visualise Geospatial Data using Microsoft Fabric Map

117 views

5 days ago

Gaurav Bisen
Claude is KILLING Data Visualization Startups! What's Next?

Anthropic just dropped a massive update - Claude can now build interactive charts, diagrams and data visualizations directly ...

5:46
Claude is KILLING Data Visualization Startups! What's Next?

73 views

1 day ago

Zentegra - Your Partner in Business Transformation
Zoho Analytics AI Update Explained | AI Data Pipelines, Smart Dashboards & MCP Server (Podcast)

AI is transforming analytics, and the latest updates in Zoho Analytics are making data preparation, dashboard creation, and ...

7:28
Zoho Analytics AI Update Explained | AI Data Pipelines, Smart Dashboards & MCP Server (Podcast)

31 views

4 days ago

Sahayika
Largest Military Forces in History: 226 Years of Data Visualization

Explore over two centuries of global military power! This video showcases the number of active military personnel by country from ...

10:03
Largest Military Forces in History: 226 Years of Data Visualization

56 views

6 days ago

Data Analyst
World's Largest Chicken Producing Nations 1961–2025

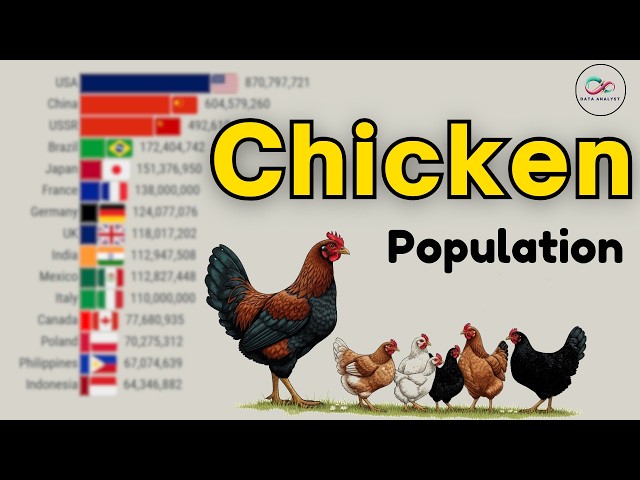
This data visualization video shows World's Largest Chicken Producing Nations 1961–2025 For new videos, Stay connected with ...

8:11
World's Largest Chicken Producing Nations 1961–2025

8,501 views

5 days ago

Microsoft Security
Explore and analyze lake data with Jupyter Notebooks

Use Jupyter Notebooks to query, enrich and create visualizations directly within the notebook environment. To learn more about ...

6:17
Explore and analyze lake data with Jupyter Notebooks

70 views

4 days ago

aicuflow
aicuflow Visualization Tutorial: Build Charts & Insights in Seconds

Data visualization is one of the most powerful ways to understand complex datasets. In this video, we explore how aicuflow ...

5:50
aicuflow Visualization Tutorial: Build Charts & Insights in Seconds

72 views

5 days ago

Bryan Medway
Tune / Datalogger analyzation + visualization tool
5:59
Tune / Datalogger analyzation + visualization tool

214 views

4 days ago

Csoda81
matlab What Is Data Visualization?

What is data visualization three things you need to know data visualization is the process of translating data into graphical ...

14:36
matlab What Is Data Visualization?

0 views

2 days ago

DataViz with Rishi
📊 Netflix Dashboard in Power BI | Data Analysis Project for Beginners

This project demonstrates how raw data can be transformed into meaningful insights using data visualization techniques. In this ...

5:07
📊 Netflix Dashboard in Power BI | Data Analysis Project for Beginners

90 views

6 days ago

Data science world
Power BI Tutorial for Beginners | Data Visualization & Business Intelligence #PowerBI #Data

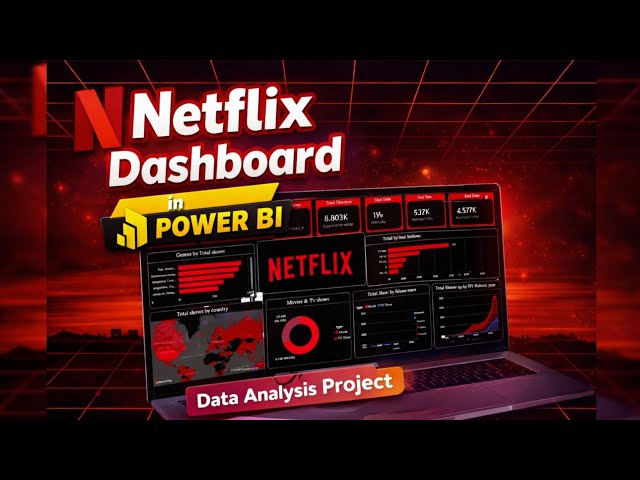
Microsoft Power BI is a powerful business intelligence (BI) and data visualization tool developed by Microsoft. It allows users to ...

12:16
Power BI Tutorial for Beginners | Data Visualization & Business Intelligence #PowerBI #Data

0 views

7 days ago

Horizon Analytics
Every Nuclear Explosion in History Mapped (1945 - 2017)

... The Peak of the Cold War Arms Race Modern North Korean Underground Tests If you enjoyed this data visualization of nuclear ...

9:07
Every Nuclear Explosion in History Mapped (1945 - 2017)

11,779 views

7 days ago

DataPopkorn
Ioannis Philippides  - Power BI Tips & Tricks I Wish I Knew Earlier #DataPopkorn

Skilled in data visualization and the use of various analytical tools and software. Committed to continuous learning and staying ...

5:48
Ioannis Philippides - Power BI Tips & Tricks I Wish I Knew Earlier #DataPopkorn

6 views

5 days ago