Upload date
All time
Last hour
Today
This week
This month
This year
Type
All
Video
Channel
Playlist
Movie
Duration
Short (< 4 minutes)
Medium (4-20 minutes)
Long (> 20 minutes)
Sort by
Relevance
Rating
View count
Features
HD
Subtitles/CC
Creative Commons
3D
Live
4K
360°
VR180
HDR
387,240 results
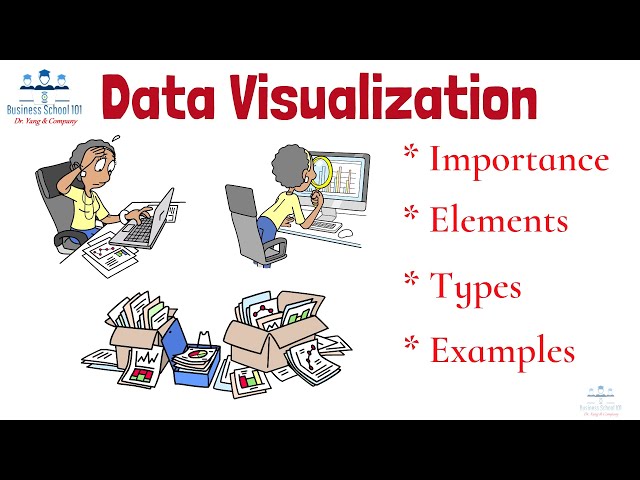
Have you ever looked at a spreadsheet full of numbers and felt completely overwhelmed? You're not alone. That's why today ...
2,234 views
4 months ago
Try RESPLENDENT DATA for FREE and unlock the full potential of your data: https://resplendentdata.com/mochen Portfolio, ...
6,288 views
9 months ago
MENTORSHIP – Applications for the March 2026 cohort are now open! Apply here → https://theanalyticsaccelerator.com/ We're ...
51,392 views
11 months ago
In this video we take a look at the best resources to learn Data Visualization in 2025! 25% off Analyst Builder Code: ...
16,008 views
I tested 30 ways to use Claude for data visualization so you don't have to. Here's what actually works. If you work in finance or ...
2,699 views
19 hours ago
There are so many chart types to choose from out there, but there are nine that will cover the majority of your needs. In this video ...
7,071 views
2 months ago
Nano Banana + Gemini 3: The Data Visualization Workflow You Need | Stop Making Boring Charts – Use This Nano Banana + ...
25,178 views
3 months ago
Most people misunderstand data visualization jobs. When you hear “data visualization,” you probably think dashboards, charts, ...
78 views
3 weeks ago
Ready to become a certified Cognos Analytics v12 Analyst? Register now and use code IBMTechYT20 for 20% off of your exam ...
12,917 views
44 views
Data Visualization | Machine learning ...
5,564 views
What Is Data Visualization Ethics? In this informative video, we will discuss the principles of data visualization ethics and why they ...
107 views
10 months ago
Here's my multi Claude Code workflow with voice input, showing how to process and visualize data with Python and a bit of ...
14,123 views
322. Data Visualization on Manus ~~~~~~~~~~~~~~~~~~~~~ Welcome to heart of a teacher. I taught in schools for 27 years and ...
1,128 views
6 months ago
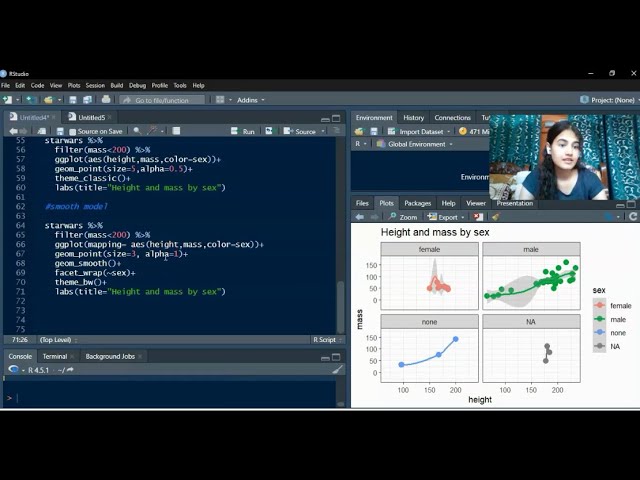
In this tutorial, you'll learn how to create a variety of plots using ggplot2 in R, based on the Grammar of Graphics framework.
131 views
5 months ago
Learn MATPLOTLIB Data Visualization in the quickest and easiest way for Information Practices (IP) Class XII preparation.
40 views
2 days ago
Discover how AI revolutionizes how we create and interact with diagrams, making complex processes simpler and faster. Whether ...
17,517 views
We are happy to have Jeroen back! This time with a Tutorial that will help you hopefully sooner or later in your career: Map ...
4,438 views
At the 1900 World's Fair in Paris, W. E. B. Du Bois displayed beautiful "data portraits" showing the lives of Black Americans.
62 views
Visually explained breakdown of Python vs Power BI for data visualization, showing when to use code and when to use tools.
19,077 views
8 months ago