Upload date
All time
Last hour
Today
This week
This month
This year
Type
All
Video
Channel
Playlist
Movie
Duration
Short (< 4 minutes)
Medium (4-20 minutes)
Long (> 20 minutes)
Sort by
Relevance
Rating
View count
Features
HD
Subtitles/CC
Creative Commons
3D
Live
4K
360°
VR180
HDR
10,656,466 results
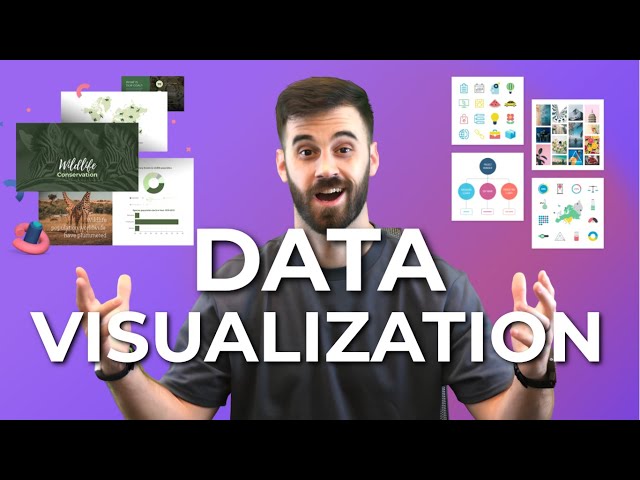
You've probably heard the term data visualization thrown around a lot. It's why you're here, isn't it? So let's make it clear — data ...
181,834 views
3 years ago
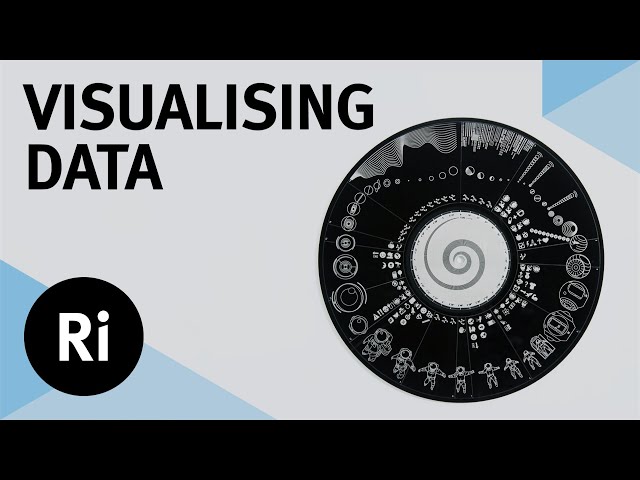
Effective data visualisation comes in many shapes and sizes, but how do you move away from a standard bar chart? Watch the ...
79,050 views
4 years ago
View full lesson: http://ed.ted.com/lessons/david-mccandless-the-beauty-of-data-visualization David McCandless turns complex ...
1,569,665 views
13 years ago
Let's look at how we can implement design concepts and techniques to maximize the impact of our dashboards and reports.
86,900 views
MENTORSHIP – Applications for the March 2026 cohort are now open! Apply here → https://theanalyticsaccelerator.com/ We're ...
51,130 views
11 months ago
Data visualization is present in every aspect of our lives - but is it really as unbiased as it's said to be? In this SciToons video, learn ...
138,724 views
7 years ago
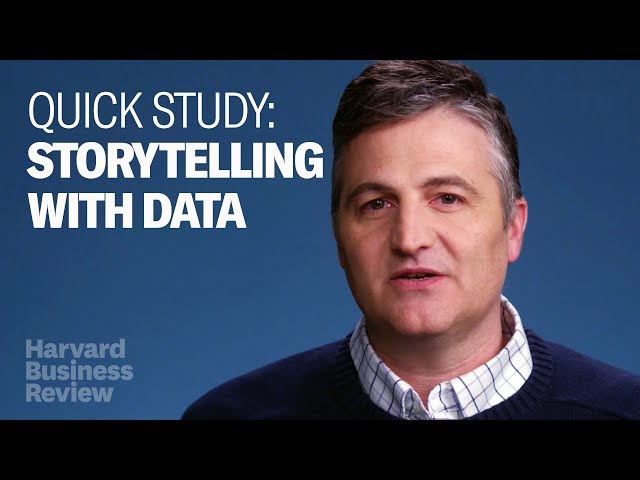
Setup, conflict, resolution. You know right away when you see an effective chart or graphic. It hits you with an immediate sense of ...
638,539 views
6 years ago
Nano Banana + Gemini 3: The Data Visualization Workflow You Need | Stop Making Boring Charts – Use This Nano Banana + ...
25,111 views
3 months ago
"️ IBM - Data Analyst ...
320,972 views
8 years ago
Links mentioned in this video ⬇️ Exercise File ...
250,449 views
2 years ago
Learn Data Visualization with D3, JavaScript, and React. Part 2: https://youtu.be/H2qPeJx1RDI Created by @currankelleher .
519,618 views
5 years ago
Viewers like you help make PBS (Thank you ) . Support your local PBS Member Station here: http://to.pbs.org/Donateoffbook ...
510,536 views
12 years ago
Following a look at 'Sensemaking' Associate Professor Dr Kai Xu delves into some more tricks of the visualisation trade.
75,405 views
Data storytelling is one of the most important skills for any data professional. Those who do it effectively can drive serious impact ...
23,650 views
1 year ago
In this video, I break down some of the 'science' behind effective data visualization and how you can build better dashboards by ...
384,291 views
Turn raw data into stunning visual stories with our new IDE course, Data Visualization in Python! If you've ever stared at a ...
15,617 views
5 months ago
Dustin hopes that the audience learns how anyone can use data visualization to improve their work, understand their world, and ...
72,998 views
In this video, we will demonstrate the difference between data visualization charts including: - Bar Chart - Line Chart - Bubble ...
189,232 views
This comprehensive tutorial will teach you everything you need to know about Excel chart types, chart customization, and creating ...
111,574 views
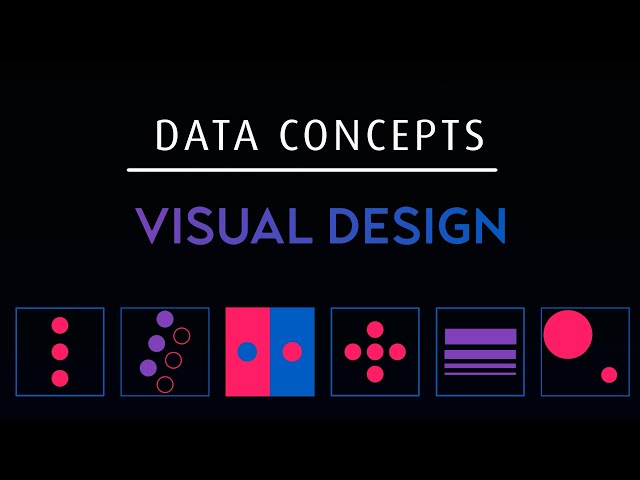
In this brief video, we define what data visualization is – and what it isn't – and how psychology plays a role in helping humans ...
7,014 views
Join my Academy, learn Data & AI skills and land a job https://analyticsautomation.academy/ Mind map available here ...
4,871 views
4 months ago
In this video we take a look at the best resources to learn Data Visualization in 2025! 25% off Analyst Builder Code: ...
15,991 views
9 months ago
Learn data visualization with D3.js. D3 is a JavaScript library for manipulating documents based on data. D3 helps you bring data ...
365,152 views
Have you heard about data visualisations, wondered what a visualisation is, why they are so popular, or how you can understand ...
52,086 views
Find out how data visualization transforms the way we consume information—and why it's such a powerful force in marketing and ...
173,175 views
14 years ago