Upload date
All time
Last hour
Today
This week
This month
This year
Type
All
Video
Channel
Playlist
Movie
Duration
Short (< 4 minutes)
Medium (4-20 minutes)
Long (> 20 minutes)
Sort by
Relevance
Rating
View count
Features
HD
Subtitles/CC
Creative Commons
3D
Live
4K
360°
VR180
HDR
6,037 results
Claude just made 90% of data visualization tools obsolete - and it happened in a single update.** Today's AI Daily Brief dives ...
0 views
3 hours ago
A data visualization done to graph the age range of politicians in Congress, and to assess the longevity of their political careers.
6 days ago
Choosing the right chart can make the difference between confusing data and clear insights. In this video, I walk through a simple ...
142 views
4 days ago
Countries Poorer than India in 2025 | GDP per capita of India from 1980-2026.
3,164 views
5 days ago
This video walks through how to run a RuFaS simulation by creating biophysical input files, linking metadata and file paths, and ...
26 views
What if the traditional rules of data visualization aren't always the right ones? Data designer and educator Kelsey Nanan reflects ...
3 days ago
Learn how to create a 3D bar chart in Excel quickly and professionally in this step-by-step tutorial. In this video, you will discover ...
Data Visualization, Bridging the Gap, Transforming Complex Data Insights into Business Narratives Big Data & Analytics Summit ...
5 views
Work with me to land your first job in data analytics: https://bit.ly/4rXFZer You've been lied to, more courses won't get you hired.
6,184 views
... This online Data Science course equips you with end-to-end skills—from Python refresher, SQL, Data visualization to advanced ...
2,677 views
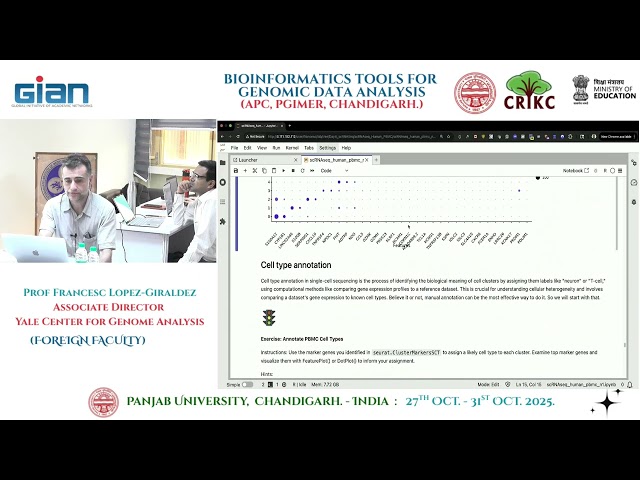
Yep cluster markers one thing to confirm your theory is to um you can visualize them once you create a list of markers um you ...
7 days ago
Google Looker Studio is a free data visualization and business intelligence tool developed by Google. It allows users to transform ...
98 views
Explore over two centuries of global military power! This video showcases the number of active military personnel by country from ...
49 views
In this course, students will explain techniques for building data visualizations and dashboards using programming libraries and ...
What is data visualization three things you need to know data visualization is the process of translating data into graphical ...
1 day ago
Which nation truly owns the crown of happiness? Did you know that 87% of information stored in the brain is received visually?
94 views
Nvidia vs. The World: The 16-Year Race for $4 Trillion Watch the incredible 16-year shift in global wealth, from the era of Big Oil ...
411 views
LLM Optimization (Quantization) Race 2020-2026: Complete Data Visualization In this video, we explore the evolution of LLM ...
7 views
How do you run a pilot of data visualization software in 14 days (practical plan)? Learn how to run a data visualization software ...
About the Python Exchange for the Department of Energy: https://meetup.doepy.org/ Sign up here to be notified when the next ...
52 views
Microsoft Power BI is a powerful business intelligence (BI) and data visualization tool developed by Microsoft. It allows users to ...
#tableau #tableaudashboard #tableauproject #dataanalytics #dataanalyst #datavisualization #tableaututorial #dashboarddesign ...
73 views