Upload date
All time
Last hour
Today
This week
This month
This year
Type
All
Video
Channel
Playlist
Movie
Duration
Short (< 4 minutes)
Medium (4-20 minutes)
Long (> 20 minutes)
Sort by
Relevance
Rating
View count
Features
HD
Subtitles/CC
Creative Commons
3D
Live
4K
360°
VR180
HDR
82 results
One of the exciting additions to Microsoft Fabric is the Map Item which enables teams to visualize and analyze geospatial data ...
115 views
5 days ago
Pat critiques a set of panels from a figure published in the scientific journal Nature looking at a novel mechanism of defense used ...
624 views
... IBM Data Analysis Specialization - https://coursera.pxf.io/AoYOdR Tableau Data Visualization - https://coursera.pxf.io/MXYqaN ...
8,069 views
3 days ago
How do you run a pilot of data visualization software in 14 days (practical plan)? Learn how to run a data visualization software ...
0 views
2 days ago
The approach is based on using data visualization of text to generate knowledge graphs that reveal the main topical clusters, ...
235 views
12 hours ago
Assalam-o-Alaikum! Europe, aur khas tor par Germany mein Data Analytics ki jobs ka kya scope hai? Aaj ki is video mein hum ...
3,543 views
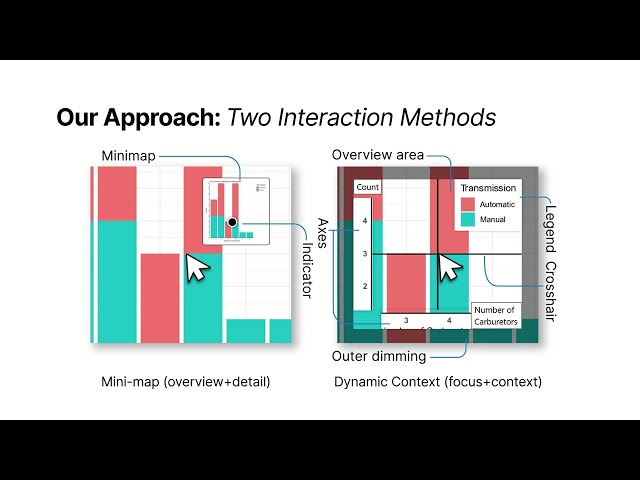
Title: Improving Low-Vision Chart Accessibility via On-Cursor Visual Context Project page: visual-context [dot] github [dot] io.
5 views
What does “single source of truth” mean in BI software? Learn what “single source of truth” means in BI software, why it matters for ...
... data sources, such as podcast analytics • Converting raw data into visual presentations • Best practices for data visualization in ...
49 views
Unlock the Power of Crime Mapping in R Do you want to turn raw crime data into powerful, visual insights? This workshop will ...
201 views
Streamed 4 days ago
... the interpretations providing a unified framework for the quality control statistical analysis data visualization and the annotations ...
4 days ago
154 views
Streamed 3 days ago
... comparison, data visualization tools, enterprise analytics, scalable BI solutions, business intelligence tips #BusinessIntelligence ...
Learn how to implement a B-tree based on Knuth's definition step by step. In this tutorial we build the node structure, implement ...
50 views
16 hours ago
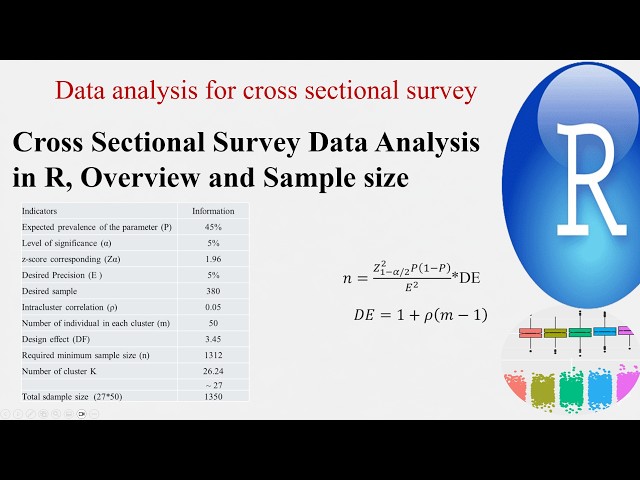
Cross Sectional Survey Data Analysis in R, Overview and Sample size Welcome to this complete YouTube course on R ...
9 views
7 days ago
reportingtool #react #datavisualization #javascript This video demonstrates how to embed a Report Viewer in a React application.
25 views
18 hours ago
+ Discord ▻ https://discord.gg/7A4AU7HMJp + TradingView ▻ https://www.tradingview.com/u/Nexural/ In this video, I do a full ...
150 views
Monday, Feb 02, 2026 10:00 am - 12:00 pm Presenter: Ryan Horne Networks are everywhere, moving through digital and ...
89 views
In this livestream, Pat refactors a panel of images from a paper recently published in Nature using two approaches that leverage ...
476 views
Streamed 2 days ago
Learn how to create an Entity-Relationship Diagram using Barker Notation with Oracle Datamodeler. We install Datamodeler on ...
158 views


![How to embed a report viewer in a React application [2026]](/api/proxy/image?url=https%3A%2F%2Fi.ytimg.com%2Fvi%2F3CLmvi7IEVU%2Fsddefault.jpg)


