Upload date
All time
Last hour
Today
This week
This month
This year
Type
All
Video
Channel
Playlist
Movie
Duration
Short (< 4 minutes)
Medium (4-20 minutes)
Long (> 20 minutes)
Sort by
Relevance
Rating
View count
Features
HD
Subtitles/CC
Creative Commons
3D
Live
4K
360°
VR180
HDR
93 results
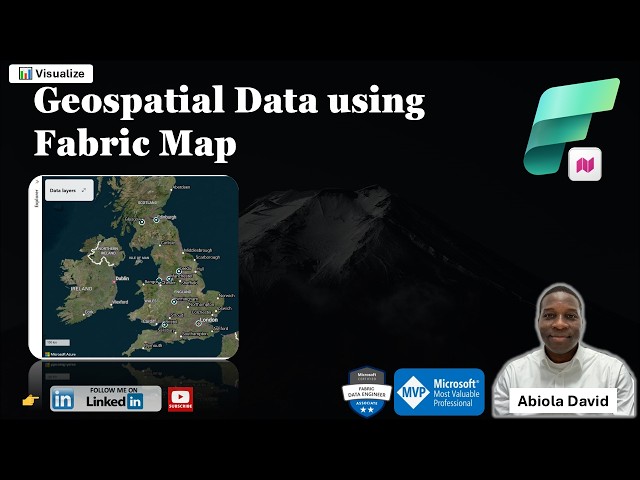
One of the exciting additions to Microsoft Fabric is the Map Item which enables teams to visualize and analyze geospatial data ...
129 views
7 days ago
... IBM Data Analysis Specialization - https://coursera.pxf.io/AoYOdR Tableau Data Visualization - https://coursera.pxf.io/MXYqaN ...
9,611 views
6 days ago
Pat critiques a set of panels from a figure published in the scientific journal Nature looking at a novel mechanism of defense used ...
654 views
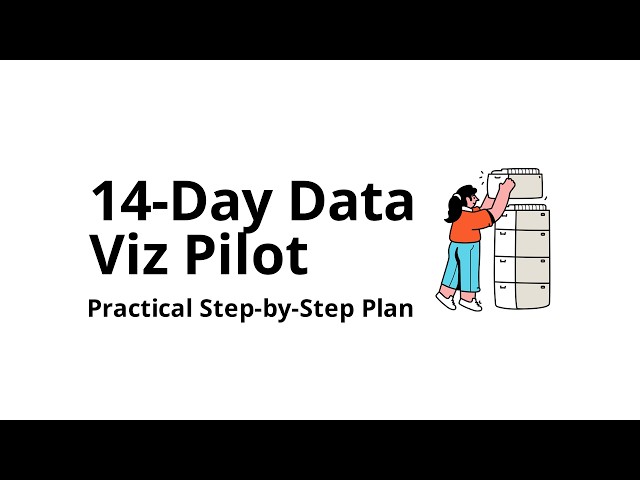
How do you run a pilot of data visualization software in 14 days (practical plan)? Learn how to run a data visualization software ...
0 views
4 days ago
Let's talk about making magic with your data. Explore our Data Visualization Services: https://lollypop.design/data-visualization/ ...
4 hours ago
... the interpretations providing a unified framework for the quality control statistical analysis data visualization and the annotations ...
1 view
The approach is based on using data visualization of text to generate knowledge graphs that reveal the main topical clusters, ...
730 views
2 days ago
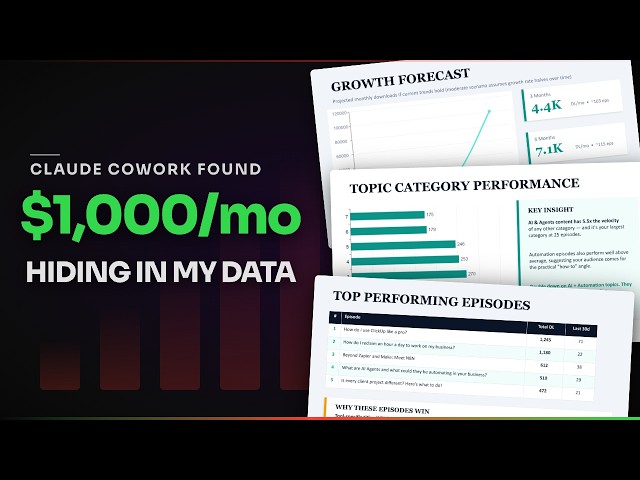
... data sources, such as podcast analytics • Converting raw data into visual presentations • Best practices for data visualization in ...
53 views
What does “single source of truth” mean in BI software? Learn what “single source of truth” means in BI software, why it matters for ...
... https://youtu.be/3h9RJFtdCdw #PowerBI #PowerBIDesign #PowerBITutorial #DataVisualization #dashboarddesign.
... #PowerBIDesign #PowerBITips #DataVisualization #BusinessIntelligence Power BI is a trademark of Microsoft Corporation.
5 days ago
Unlock the Power of Crime Mapping in R Do you want to turn raw crime data into powerful, visual insights? This workshop will ...
161 views
Streamed 6 days ago
... comparison, data visualization tools, enterprise analytics, scalable BI solutions, business intelligence tips #BusinessIntelligence ...
In this livestream, Pat refactors a panel of images from a paper recently published in Nature using two approaches that leverage ...
548 views
Streamed 5 days ago
This case study features Prof. Alan Smeaton, Professor of Computing at Dublin City University (DCU). In this video, Professor ...
1 day ago
Nano Banana 2 is changing AI filmmaking. It's the first ever AI image generator able to research the real world while generating ...
25,775 views
reportingtool #react #datavisualization #javascript This video demonstrates how to embed a Report Viewer in a React application.
34 views
3 days ago
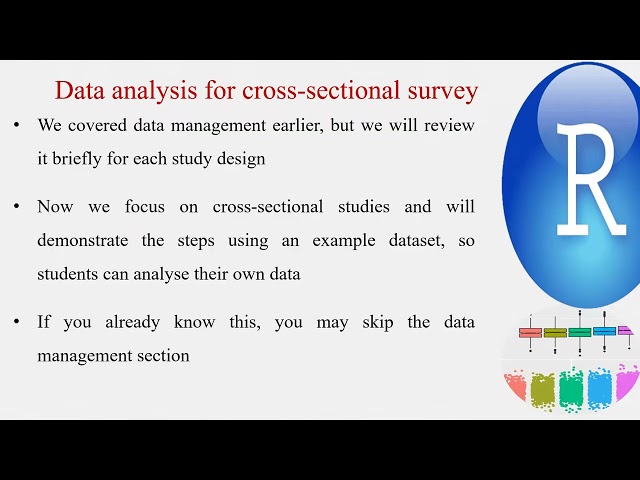
Cross sectional data description R Programming and RStudio for Data Analysis, Epidemiology & Biostatistics Welcome to this ...
Monday, Feb 02, 2026 10:00 am - 12:00 pm Presenter: Ryan Horne Networks are everywhere, moving through digital and ...
95 views
If you enjoy data visualization, global business rankings and comparison videos, make sure to like the video and subscribe for ...
587 views


![How to embed a report viewer in a React application [2026]](/api/proxy/image?url=https%3A%2F%2Fi.ytimg.com%2Fvi%2F3CLmvi7IEVU%2Fsddefault.jpg)