Upload date
All time
Last hour
Today
This week
This month
This year
Type
All
Video
Channel
Playlist
Movie
Duration
Short (< 4 minutes)
Medium (4-20 minutes)
Long (> 20 minutes)
Sort by
Relevance
Rating
View count
Features
HD
Subtitles/CC
Creative Commons
3D
Live
4K
360°
VR180
HDR
6,196 results
A short introduction to the core concepts of data visualization and their application to network biology. The presentation provides a ...
4,611 views
4 years ago
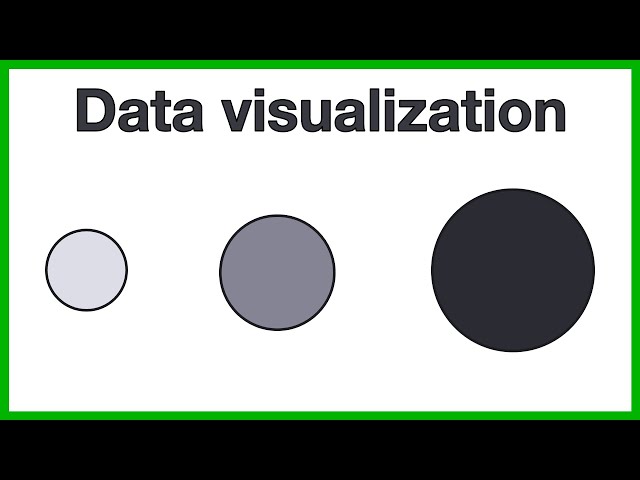
Presented by Alisa Rod. This video is part of a series of lectures recorded to teach about basic data visualization concepts.
326 views
Presented by David Christensen. This video is part of a series of lectures recorded to teach about basic data visualization ...
316 views
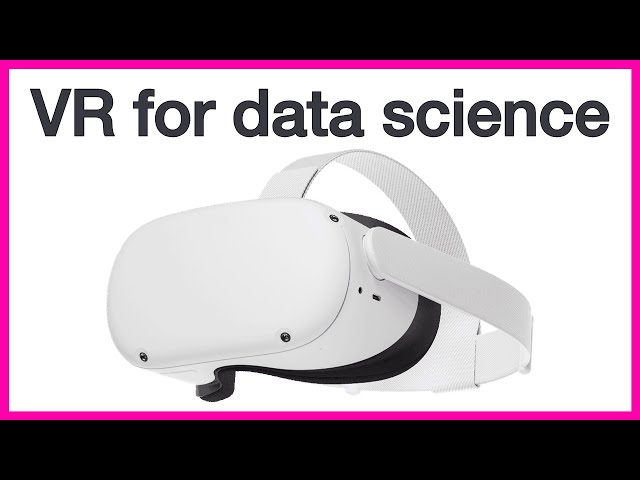
A quick overview of the current state of virtual reality for data science and my expectations for the future. I first go over the issues ...
3,932 views
3 years ago
A short film describing the development of a prototype application for the Oculus Rift DK2 headset, to visualise subsurface ...
8,070 views
10 years ago
Test our community for 7-days trial: https://surfalytics.com/ Visit our GitHub repository: https://github.com/surfalytics Join Dmitry ...
171 views
1 year ago
Presented by Angela Zoss. This video is part of a series of lectures recorded to teach about basic data visualization concepts.
102 views
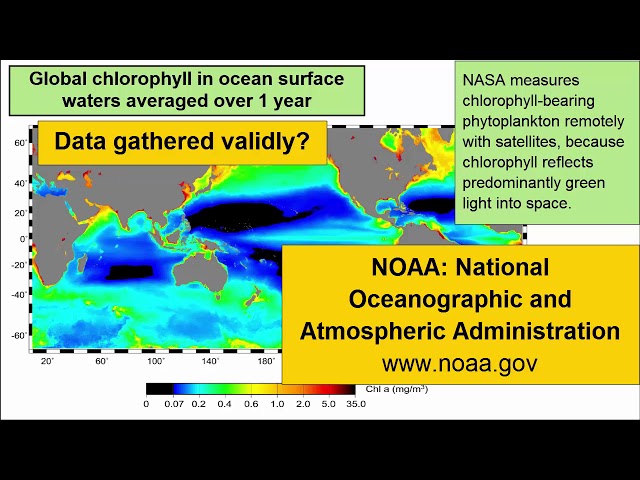
For an introductory college-level earth sciences class: a review of how to read and critically evaluate data visualizations such as ...
9,005 views
8 years ago
Presented by Tess Grynoch. This video is part of a series of lectures recorded to teach about basic data visualization concepts.
29 views
169 views
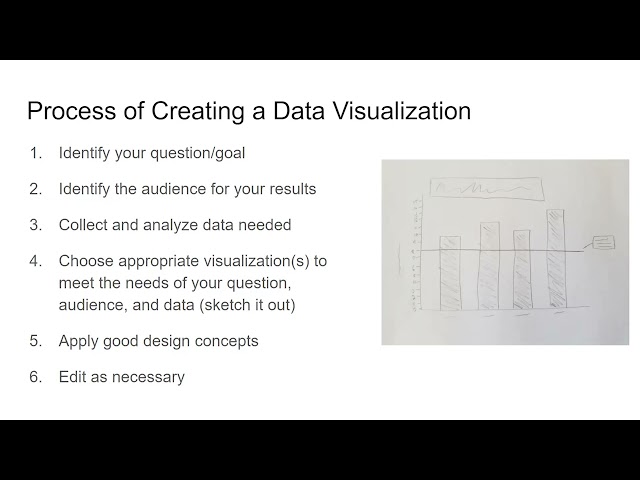
In this video, I share an idea that can help #datateams and #dataleaders better approach and structure their #dataviz projects.
70 views
5 years ago
... Katrina and Tim dive into the key differences between Sigma and Tableau, two leading data visualization tools. Katrina recounts ...
7,681 views
59 views
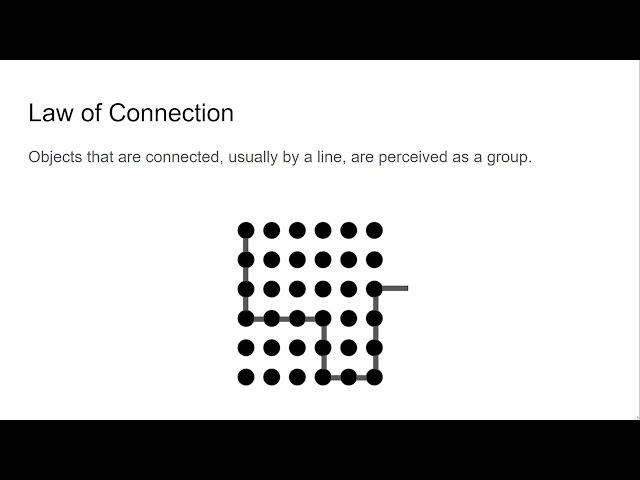
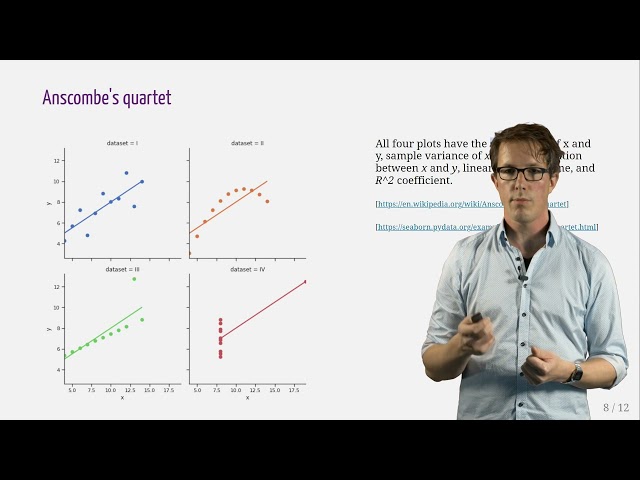
Featuring Dr. Radovan Bast from UiT the Arctic University of Norway, this video is a part of the DocEnhance Course on Data ...
282 views
2 years ago
This tutorial delves into the foundational tools (e.g., Matplotlib, Seaborn, Pandas)for data visualization in Python. We'll explore bar ...
600 views
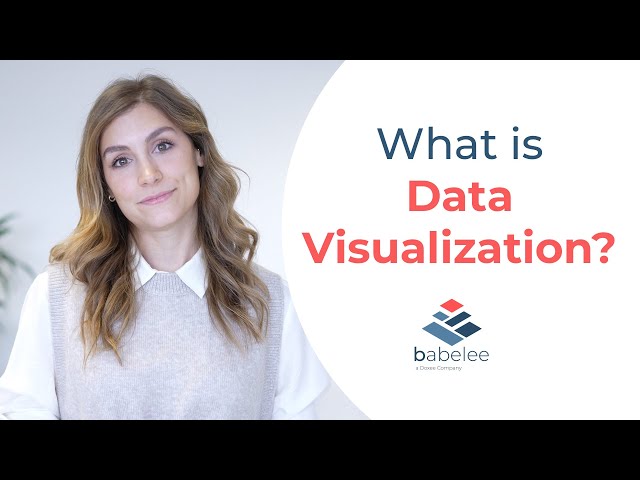
Let's talk about Data Visualization! We've been hearing this expression a lot lately, but do you really know how to put your data in ...
179 views
Welcome test reporting quickly episode and this episode will be looking at data visualization so today's quickly will be sticking to ...
166 views
Using https://infranodus.com you can visualize the content of any CSV spreadsheet as a knowledge graph, so you can see the ...
2,524 views
Check out the updated Gitools interface in the TCGA multidimensional cancer data introduction ...
2,176 views
14 years ago