ViewTube

ViewTube
Sign inSign upSubscriptions
Filters

Upload date

Type

Duration

Sort by

Features

Reset

67 results

Excel Tricks Tips
How to Create  Dynamic Excel Chart (Step-by-Step) || #excel  #excelchartstutorial

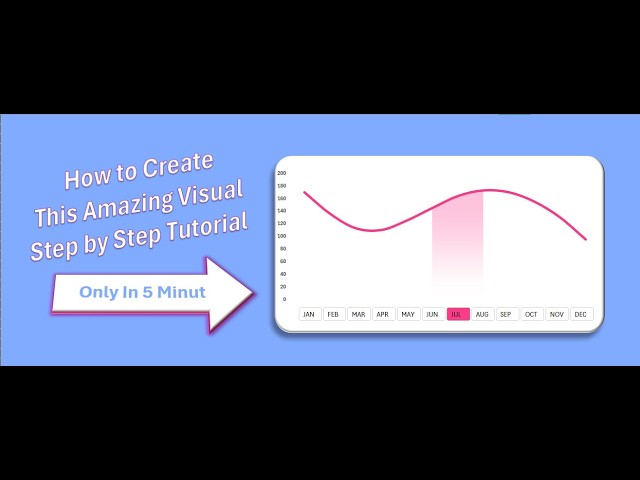
In this video, you'll learn how to create an amazing interactive Excel chart step by step in just 5 minutes. This dynamic chart allows ...

5:22
How to Create Dynamic Excel Chart (Step-by-Step) || #excel #excelchartstutorial

0 views

2 hours ago

Excel For U
99% Excel Users Don’t Know This Progress Doughnut Chart Trick!

... excel progress doughnut chart progress chart in excel excel chart tutorial excel dashboard chart excel data visualization excel ...

2:10
99% Excel Users Don’t Know This Progress Doughnut Chart Trick!

0 views

5 hours ago

Abrar Knowledge
Stem and leaf 🌿🍀 plot in Excel #illustration #excelstatistics #datavisualization

Learn how to quickly create a Stem and Leaf Plot in Excel using simple formulas and shortcuts! A Stem-and-Leaf Plot is a ...

21:13
Stem and leaf 🌿🍀 plot in Excel #illustration #excelstatistics #datavisualization

0 views

3 hours ago

VSDL Excel Pro
Dynamic Progress Chart in Excel  Step by Step Tutorial

Learn Excel step by step with VSDL Excel Pro. Learn how to create a Dynamic Progress Chart in Microsoft Excel to track progress ...

6:30
Dynamic Progress Chart in Excel Step by Step Tutorial

9 views

23 hours ago

The Power BI with Sudhir
How AI Is Changing the Way We Use Power BI (New Era of Analytics)

PowerBI#ArtificialIntelligence#DataAnalytics#BusinessIntelligence#AIvsBI#AnalyticsCareer#MicrosoftPowerBI#FutureOfAI# ...

5:41
How AI Is Changing the Way We Use Power BI (New Era of Analytics)

32 views

22 hours ago

Smart Dolphins IT
Excel For Finance Professionals and Accountants - Hosted by Smart Dolphins

Enhance your ability to work with financial data by mastering Excel features tailored to accounting and finance tasks. This webinar ...

50:34
Excel For Finance Professionals and Accountants - Hosted by Smart Dolphins

19 views

21 hours ago

SHEQXEL
🚀 Safety Observation Visit (SOV) Dashboard – Built in Power BI

Data Visualization Services: https://www.sheqxel.com/data-visualization-service/ SHEQXEL Data Academy — where HSE meets ...

9:01
🚀 Safety Observation Visit (SOV) Dashboard – Built in Power BI

24 views

13 hours ago

GenAI Skool
6 - KPI Formulas, Slicer Sync & Live Updates

In the final lesson of the course, you'll enhance the retail dashboard with KPI formulas, synchronized slicers, and live-updating ...

5:17
6 - KPI Formulas, Slicer Sync & Live Updates

4 views

18 hours ago

She Explores Data
20 Excel Formulas Every Data Analyst Must Know | Excel for Data Analysis 🔥

If you're a Data Analyst (or want to become one), these 20 Excel formulas are non-negotiable. From VLOOKUP, XLOOKUP, and ...

0:09
20 Excel Formulas Every Data Analyst Must Know | Excel for Data Analysis 🔥

259 views

9 hours ago

Excel tutorial
Excel Chart Hack 😲 | Different Data Selection in Line Chart Explained| EXCELINDIA0811

इस चैनल पर आपको Microsoft Excel के आसान और practical tutorials मिलेंगे, जो beginners से लेकर ...

3:12
Excel Chart Hack 😲 | Different Data Selection in Line Chart Explained| EXCELINDIA0811

79 views

21 hours ago

Andy Cotgreave
How to create data stories in PowerPoint with Claude

... #Powerpoint #claude #dataanlysis #datavisualization Links to more of my content: My newsletter: http://tabsoft.co/sweetspot ...

1:27
How to create data stories in PowerPoint with Claude

27 views

1 day ago

Connect To Learn
End-to-End Data Analytics Project (Excel + Python + SQL + Power BI) Analysis in MySQL |#sql

Part 3: Advanced SQL Analysis | End-to-End Data Analytics Project Video Description: Welcome back to Part 3 of our ...

5:52
End-to-End Data Analytics Project (Excel + Python + SQL + Power BI) Analysis in MySQL |#sql

11 views

23 hours ago

Future Vision computers
Business Analytics Course in Surat | Excel + Power BI + SQL Skills

In our Business Analytics Course, you will learn: • Advanced Excel for data analysis • Data visualization using Power BI • SQL ...

1:16
Business Analytics Course in Surat | Excel + Power BI + SQL Skills

0 views

2 hours ago

Excel Point Nepal
Learn For Loop in Excel VBA with 6 Real World Examples | Excel in Nepali

Welcome to Excel Point Nepal! In this video, you will learn For Loop in Excel VBA with 6 real world examples in simple and ...

26:40
Learn For Loop in Excel VBA with 6 Real World Examples | Excel in Nepali

51 views

1 day ago

BI Brilliance Tamil
Power BI Drill Down Explained in 60 Seconds 🚀

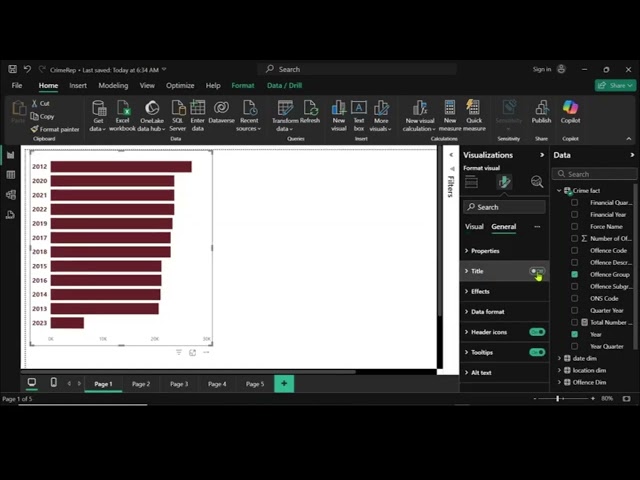
Most Power BI users only show daily sales trends. But professional dashboards allow business users to drill down from Year ...

1:00
Power BI Drill Down Explained in 60 Seconds 🚀

0 views

1 day ago

Posit PBC
Managing data platforms for 600 analysts | Tom Grace | Data Science Hangout

... Data Visualization Course → https://openvisualizationacademy.org/courses/accessibility-in-data-visualization/ Posit Package ...

53:31
Managing data platforms for 600 analysts | Tom Grace | Data Science Hangout

89 views

23 hours ago

Rizwan Graphic Designer
Class # 96 MS Excel 2007 Formula Tab_Financial_Future Value_RD Amount_Rate of Interest_Time (Years)

I'm “Rizwan Accounts Expert”, a Microsoft Excel expert. I am a Accounts & Internal & External Audit expert of Ms excel with over 05 ...

16:22
Class # 96 MS Excel 2007 Formula Tab_Financial_Future Value_RD Amount_Rate of Interest_Time (Years)

7 views

14 hours ago

Syncfusion, Inc
Angular Charts: Legend Feature Walkthrough

In this video, explore how the legend feature in Syncfusion® Angular Charts makes data visualization clear and intuitive by ...

3:15
Angular Charts: Legend Feature Walkthrough

22 views

21 hours ago

Excel Point Nepal
Excel VBA For Each Loop Tutorial in Nepali | 8 Real Examples for Beginners | Excel Nepal

In this Excel VBA tutorial in Nepali, we will learn one of the most useful automation concepts in Excel — For Each Loop in Excel ...

27:07
Excel VBA For Each Loop Tutorial in Nepali | 8 Real Examples for Beginners | Excel Nepal

0 views

1 hour ago

DataForge AI Academy
02n PowerBI

In this video, I introduce you to Power BI. If Excel builds your foundation, Power BI unlocks true business intelligence. This tool ...

11:01
02n PowerBI

0 views

21 hours ago