Upload date
All time
Last hour
Today
This week
This month
This year
Type
All
Video
Channel
Playlist
Movie
Duration
Short (< 4 minutes)
Medium (4-20 minutes)
Long (> 20 minutes)
Sort by
Relevance
Rating
View count
Features
HD
Subtitles/CC
Creative Commons
3D
Live
4K
360°
VR180
HDR
10,882,214 results
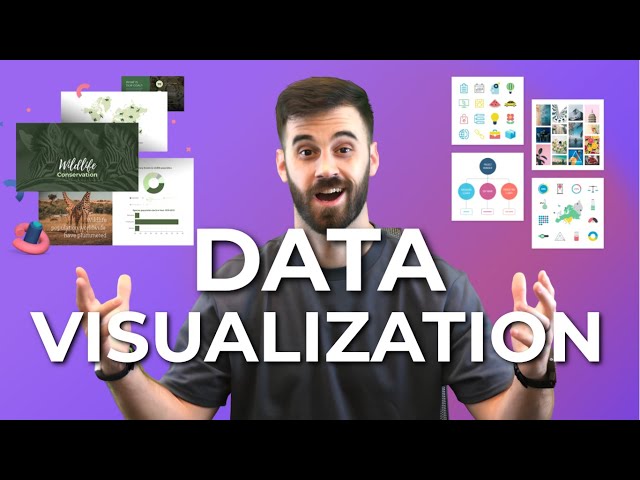
You've probably heard the term data visualization thrown around a lot. It's why you're here, isn't it? So let's make it clear — data ...
181,686 views
3 years ago
Nano Banana + Gemini 3: The Data Visualization Workflow You Need | Stop Making Boring Charts – Use This Nano Banana + ...
25,040 views
3 months ago
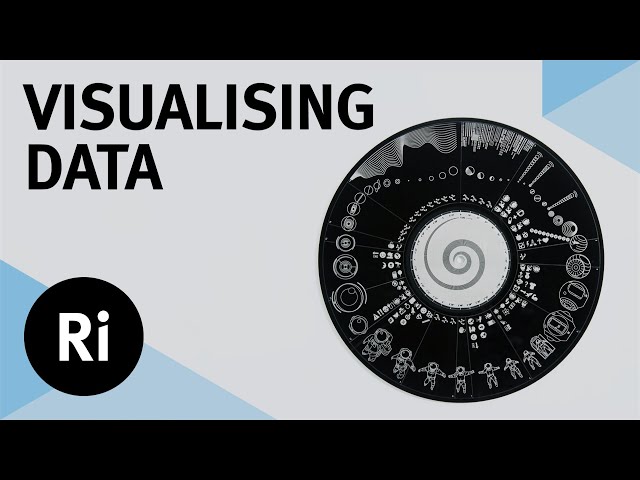
Effective data visualisation comes in many shapes and sizes, but how do you move away from a standard bar chart? Watch the ...
79,014 views
4 years ago
View full lesson: http://ed.ted.com/lessons/david-mccandless-the-beauty-of-data-visualization David McCandless turns complex ...
1,569,367 views
13 years ago
Let's look at how we can implement design concepts and techniques to maximize the impact of our dashboards and reports.
86,850 views
Data visualization is present in every aspect of our lives - but is it really as unbiased as it's said to be? In this SciToons video, learn ...
138,652 views
7 years ago
MENTORSHIP – Applications for the March 2026 cohort are now open! Apply here → https://theanalyticsaccelerator.com/ We're ...
50,895 views
11 months ago
Setup, conflict, resolution. You know right away when you see an effective chart or graphic. It hits you with an immediate sense of ...
638,120 views
6 years ago
"️ IBM - Data Analyst ...
320,839 views
8 years ago
Links mentioned in this video ⬇️ Exercise File ...
250,340 views
2 years ago
Viewers like you help make PBS (Thank you ) . Support your local PBS Member Station here: http://to.pbs.org/Donateoffbook ...
510,456 views
12 years ago
Learn Data Visualization with D3, JavaScript, and React. Part 2: https://youtu.be/H2qPeJx1RDI Created by @currankelleher .
519,581 views
5 years ago
Following a look at 'Sensemaking' Associate Professor Dr Kai Xu delves into some more tricks of the visualisation trade.
75,400 views
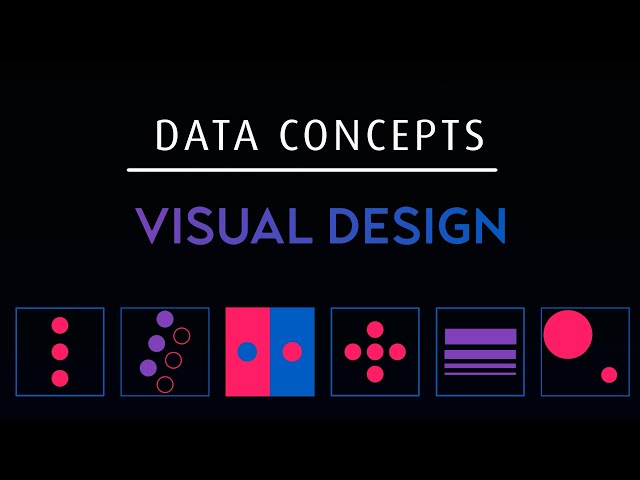
In this video, we will demonstrate the difference between data visualization charts including: - Bar Chart - Line Chart - Bubble ...
189,157 views
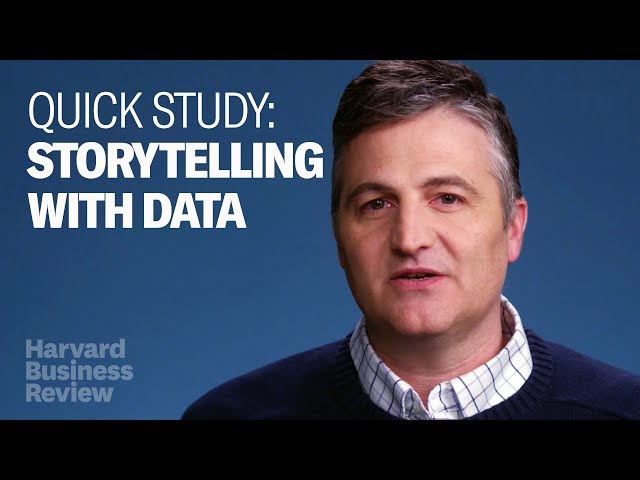
Data storytelling is one of the most important skills for any data professional. Those who do it effectively can drive serious impact ...
23,590 views
1 year ago
THE CHALLENGE: "teach me statistics in half an hour with no mathematical formula" The RESULT: an intuitive overview of ...
3,310,982 views
Lear Data Cleaning Essentials in Excel in just 10 minutes Take our Excel course: ...
1,231,652 views
Curious about a career in Data Analytics? Book a call with a program advisor: https://bit.ly/47LEBk3 What exactly is data analytics ...
2,063,490 views
This comprehensive tutorial will teach you everything you need to know about Excel chart types, chart customization, and creating ...
111,269 views
In this talk, I will chart the course of visual depictions of data over the last 200 years, from the classic data graphics of Playfair and ...
19,146 views
Dustin hopes that the audience learns how anyone can use data visualization to improve their work, understand their world, and ...
72,958 views