Upload date
All time
Last hour
Today
This week
This month
This year
Type
All
Video
Channel
Playlist
Movie
Duration
Short (< 4 minutes)
Medium (4-20 minutes)
Long (> 20 minutes)
Sort by
Relevance
Rating
View count
Features
HD
Subtitles/CC
Creative Commons
3D
Live
4K
360°
VR180
HDR
337,196 results
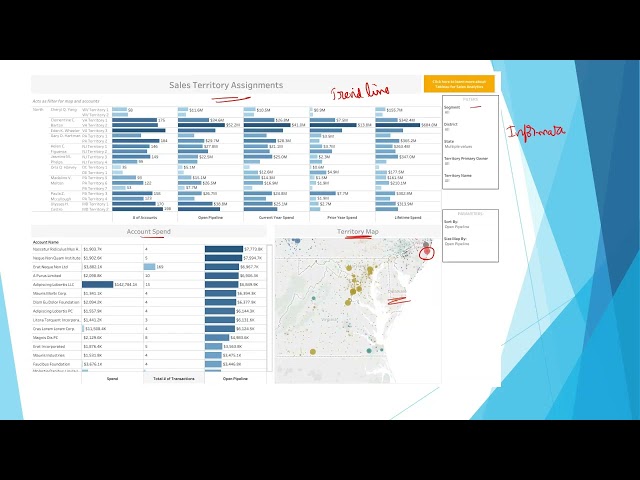
Grab this exact project template (Data Cleaning & Visualization): ...
9,175 views
2 weeks ago
Most people misunderstand data visualization jobs. When you hear “data visualization,” you probably think dashboards, charts, ...
77 views
Focusing on the demand for full-process data governance in manufacturing production lines, hightopo create a visual production ...
25 views
3 weeks ago
Learn how to sort and reorganize objects in Blender using Geometry Nodes based on any numerical value or attribute. In this ...
3,120 views
This video walks through how to run a RuFaS simulation by creating biophysical input files, linking metadata and file paths, and ...
26 views
8 days ago
Applied Linguistics Lab | East Texas A&M University Presenter: Dr. Sal Attardo, Professor of Applied Linguistics, ETAMU In this ...
41 views
This recorded workshop from UC Love Data Week 2026 will introduce you to the transformative potential of AI-assisted data ...
87 views
Master NumPy & Matplotlib in One Video | Full Beginner Tutorial Now here's a powerful YouTube description you can copy: In ...
64 views
Power BI Charts Explained | Beginner to Advanced | Data Visualization Tutorial In this video, we explain Power BI charts in a ...
0 views
In this video, we break down data visualization in plain English: what it is, why it helps business teams make faster decisions, and ...
6 views
12 days ago
Most data analysis doesn't fail because of complexity. It fails because it takes too long to go from data → understanding.
Turn complex datasets into clear, interactive insights with our advanced Data Visualization Services. We design professional ...
Learn how to create a 3D bar chart in Excel quickly and professionally in this step-by-step tutorial. In this video, you will discover ...
5 days ago
In Part 2 of this Data Visualization with Python Course 2026, you will learn how to visualize data distributions, relationships, and ...
123 views
1 month ago
Data is everywhere — but insight is rare. On this channel, we go beyond charts and dashboards. We explore how to transform raw ...
Welcome to the Looker Tutorial. This comprehensive Looker Course is designed to take you from a complete beginner to a data ...
248 views
3 views
10 days ago
In this video, you will learn Data Visualization using Matplotlib in Python in a simple and beginner-friendly way. Data visualization ...
4 views
9 days ago
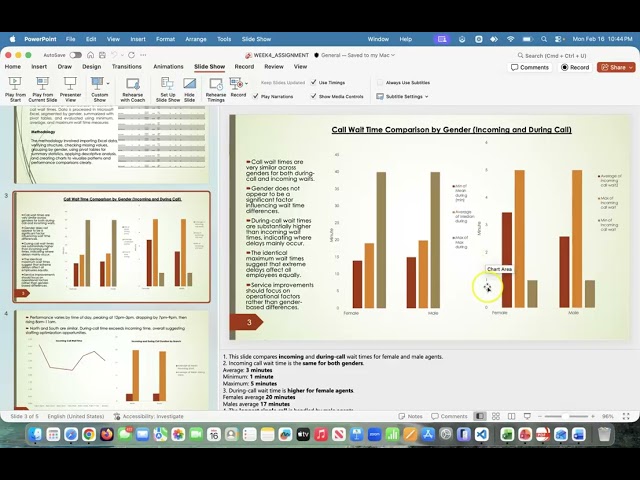
Accessibility Community of Practice - February 24, 2026 Presenter: John Cotter (NCDIT) How to build accessible data ...
129 views
Learn how to create clear and professional data visualizations by inserting charts in Microsoft Word on desktop. This tutorial ...
119 views


![Data Visualization with Python Course [2026] - Part 2: Distribution & Time Series Charts](/api/proxy/image?url=https%3A%2F%2Fi.ytimg.com%2Fvi%2Ftaa64u_CcYk%2Fsddefault.jpg)