Upload date
All time
Last hour
Today
This week
This month
This year
Type
All
Video
Channel
Playlist
Movie
Duration
Short (< 4 minutes)
Medium (4-20 minutes)
Long (> 20 minutes)
Sort by
Relevance
Rating
View count
Features
HD
Subtitles/CC
Creative Commons
3D
Live
4K
360°
VR180
HDR
4,833,275 results
Data visualisation is one of the most important tools journalists have to explain the world, even going back to the 1800s, but it's not ...
1,757 views
3y ago
On Today Now!, author Christine Eckard teaches Jim and Tracy to imagine economic problems as oily, curly-haired "Grabblers."
2,943,736 views
15y ago
In the lobby of the New York Times building.
57 views
16y ago
https://infranodus.com In this webinar that took place on the 3rd of April 2020 I am demonstrating some new features of ...
1,710 views
5y ago
A very powerful 11 minute manifestation meditation taking you on a visualisation journey to manifest your goals and desires.
1,363,784 views
4y ago
Let's look at how we can implement design concepts and techniques to maximize the impact of our dashboards and reports.
86,843 views
Are you a journalist or storyteller, interested in covering the elections, Olympics, or generally working with data to tell stories?
2,133 views
Streamed 9y ago
View full lesson: http://ed.ted.com/lessons/david-mccandless-the-beauty-of-data-visualization David McCandless turns complex ...
1,569,322 views
13y ago
Are you a journalist or storyteller, interested in working with data to tell stories? Join Simon Rogers, Data Editor News Lab, data ...
10,633 views
Clara Guibourg and Nassos Stylianou are both Senior Data Journalists for BBC News. They have been part of a Visual and Data ...
2,120 views
6y ago
Title: NewsLines: Narrative Visualization of News Stories Authors: Mariana Costa and Sérgio Nunes.
35 views
2y ago
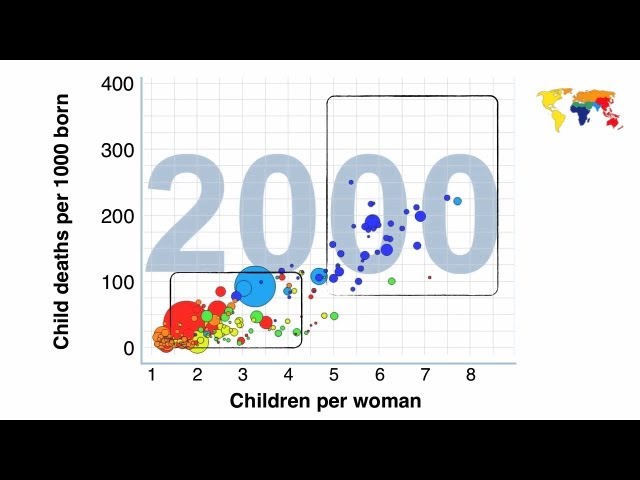
View full lesson: http://ed.ted.com/lessons/the-good-news-of-the-decade-hans-rosling Hans Rosling reframes 10 years of UN data ...
34,150 views
12y ago
[http://mobilefuture.org] Interesting 3d data visualization.
236 views
14y ago
How to use data visualization in the news as a reporting tool with Matthew Baise, Managing Editor of the VOA English website.
403 views


![Visualise and It Will Come | 11 Minute LOA Meditation VERY POWERFUL!! [Listen to Every Morning]](/api/proxy/image?url=https%3A%2F%2Fi.ytimg.com%2Fvi%2FhxQawagVj-8%2Fsddefault.jpg)